目录


1.1克隆出三台

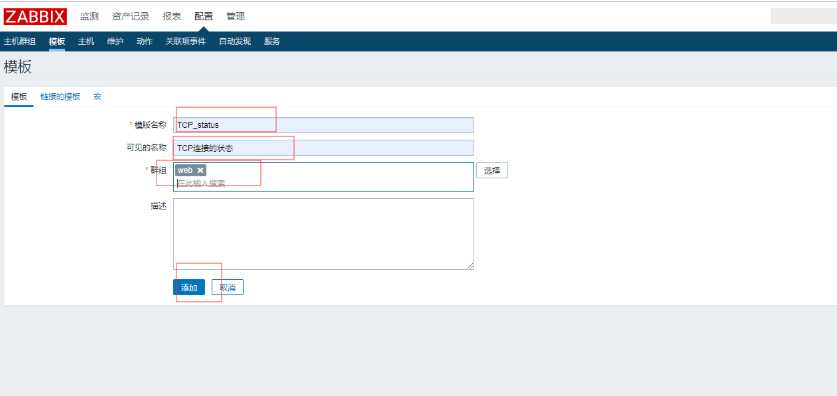
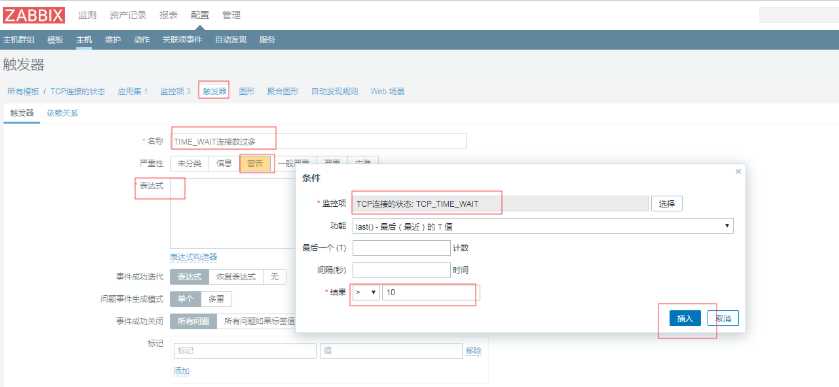
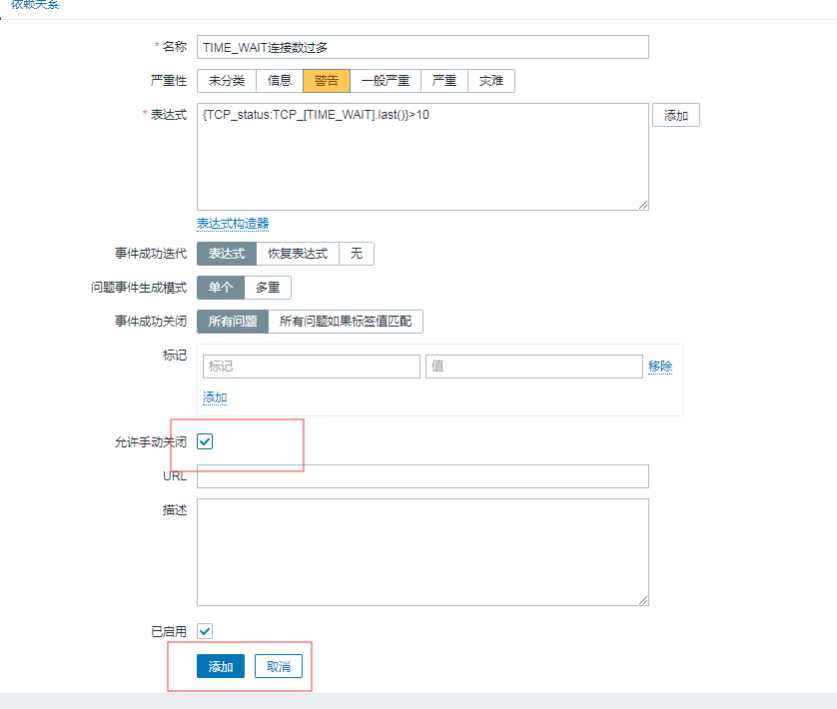
1.2直接创建好触发器


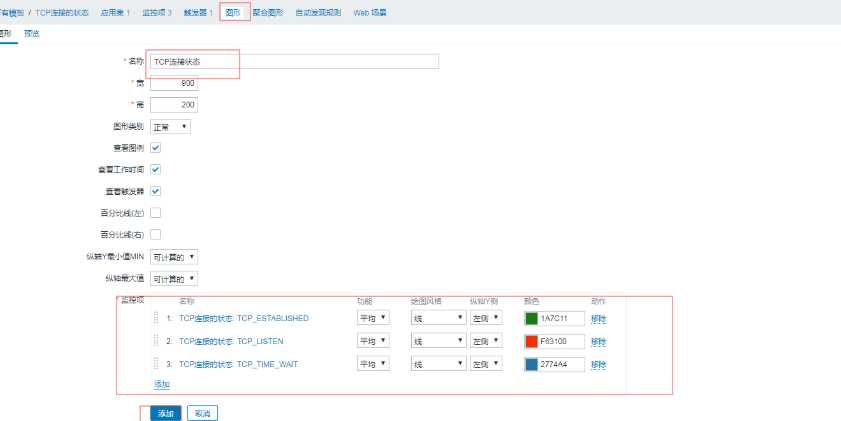
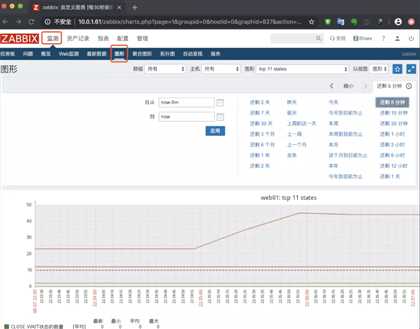
1.3创建图形
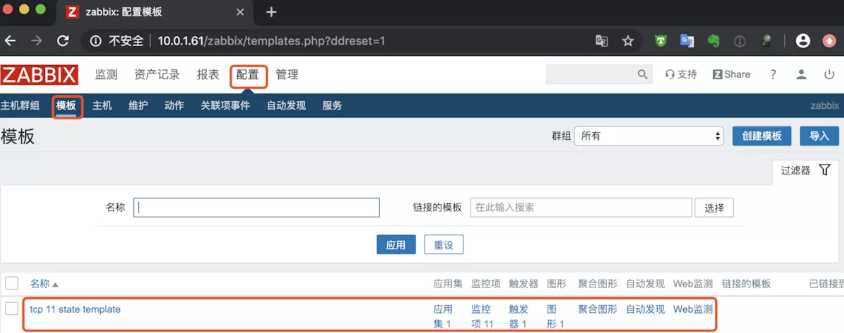
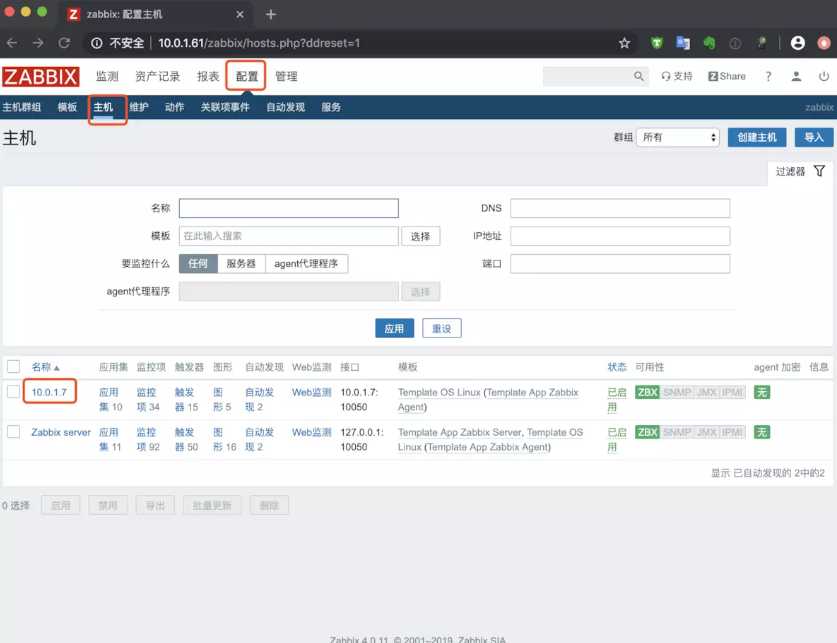
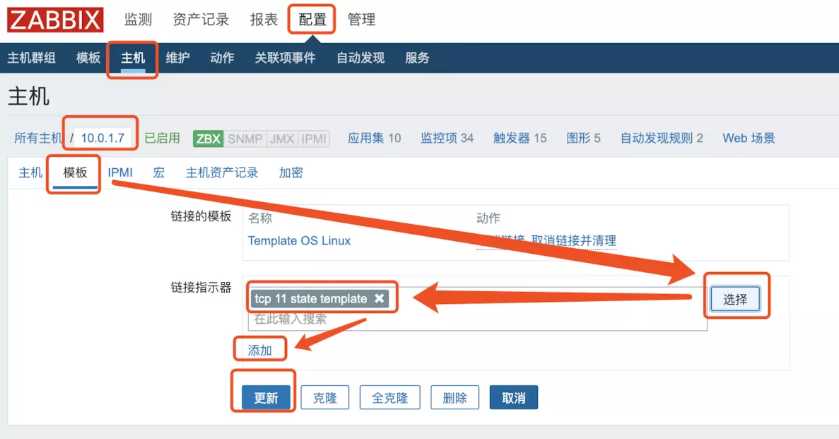
模版创建好,再次创建主机就可直接选择用
修改模版,可全部生效
例如:把时间修改成30天
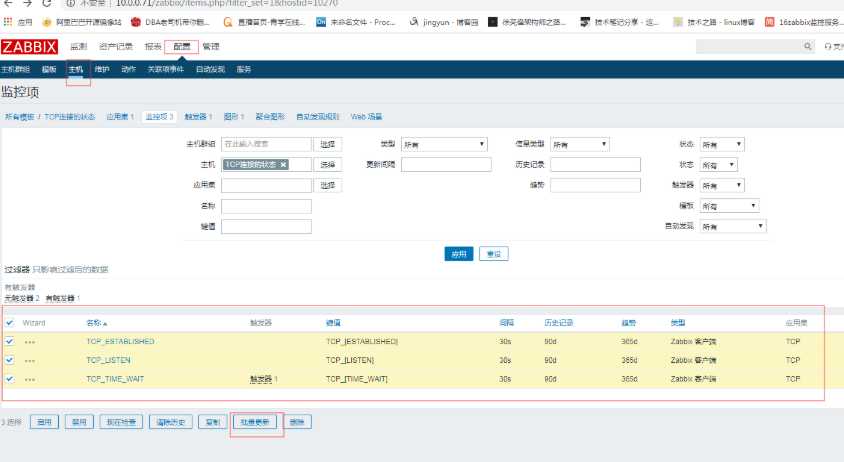


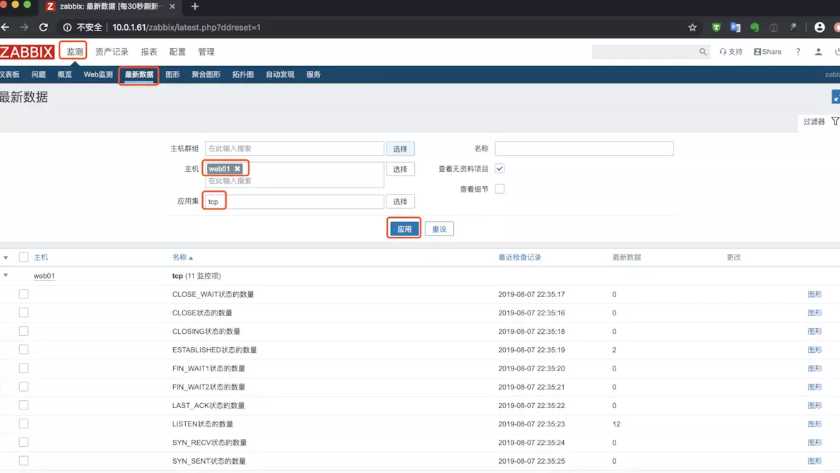
编写zabbix配置文件
[root@web01 /etc/zabbix/zabbix_agentd.d]# cat zbx_tcp.conf UserParameter=ESTABLISHED,netstat -ant|grep -c 'ESTABLISHED'UserParameter=SYN_SENT,netstat -ant|grep -c 'SYN_SENT'UserParameter=SYN_RECV,netstat -ant|grep -c 'SYN_RECV'UserParameter=FIN_WAIT1,netstat -ant|grep -c 'FIN_WAIT1'UserParameter=FIN_WAIT2,netstat -ant|grep -c 'FIN_WAIT2'UserParameter=TIME_WAIT,netstat -ant|grep -c 'TIME_WAIT'UserParameter=CLOSE,netstat -ant|grep -c 'CLOSE'UserParameter=CLOSE_WAIT,netstat -ant|grep -c 'CLOSE_WAIT'UserParameter=LAST_ACK,netstat -ant|grep -c 'LAST_ACK'UserParameter=LISTEN,netstat -ant|grep -c 'LISTEN'UserParameter=CLOSING,netstat -ant|grep -c 'CLOSING'[root@web01 ~]# systemctl restart zabbix-agent.service 使用zabbix-get命令测试
[root@m01 ~]# yum install zabbix-get.x86_64 -y[root@m01 ~]# zabbix_get -s 10.0.1.7 -k ESTABLISHED2[root@m01 ~]# zabbix_get -s 10.0.1.7 -k LISTEN12
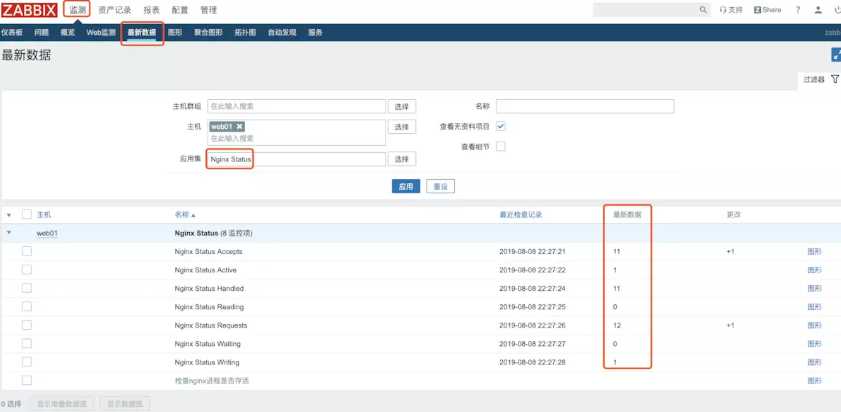
[root@web01 ~]# cat /etc/nginx/conf.d/status.conf server { listen 80; server_name localhost; location /nginx_status { stub_status on; access_log off; }}[root@web01 ~]# curl 127.0.0.1/nginx_status/Active connections: 1 server accepts handled requests 6 6 6 Reading: 0 Writing: 1 Waiting: 0 [root@web01 /etc/zabbix/zabbix_agentd.d]# cat nginx_monitor.sh #!/bin/bashNGINX_COMMAND=$1CACHEFILE="/tmp/nginx_status.txt"CMD="/usr/bin/curl http://127.0.0.1/nginx_status/"if [ ! -f $CACHEFILE ];then $CMD >$CACHEFILE 2>/dev/nullfi# Check and run the scriptTIMEFLM=`stat -c %Y $CACHEFILE`TIMENOW=`date +%s`if [ `expr $TIMENOW - $TIMEFLM` -gt 60 ]; then rm -f $CACHEFILEfiif [ ! -f $CACHEFILE ];then $CMD >$CACHEFILE 2>/dev/nullfinginx_active(){ grep 'Active' $CACHEFILE| awk '{print $NF}' exit 0;}nginx_reading(){ grep 'Reading' $CACHEFILE| awk '{print $2}' exit 0;}nginx_writing(){ grep 'Writing' $CACHEFILE | awk '{print $4}' exit 0;}nginx_waiting(){ grep 'Waiting' $CACHEFILE| awk '{print $6}' exit 0;}nginx_accepts(){ awk NR==3 $CACHEFILE| awk '{print $1}' exit 0;}nginx_handled(){ awk NR==3 $CACHEFILE| awk '{print $2}' exit 0;}nginx_requests(){ awk NR==3 $CACHEFILE| awk '{print $3}' exit 0;}case $NGINX_COMMAND in active) nginx_active; ;; reading) nginx_reading; ;; writing) nginx_writing; ;; waiting) nginx_waiting; ;; accepts) nginx_accepts; ;; handled) nginx_handled; ;; requests) nginx_requests; ;; *)echo 'Invalid credentials';exit 2;esac[root@web01 ~]# cat /etc/zabbix/zabbix_agentd.d/nginx_status.confUserParameter=nginx_status[*],/bin/bash /etc/zabbix/zabbix_agentd.d/nginx_monitor.sh $1[root@web01 ~]# systemctl restart zabbix-agent.service[root@m01 ~]# zabbix_get -s 10.0.1.7 -k nginx_status[accepts]7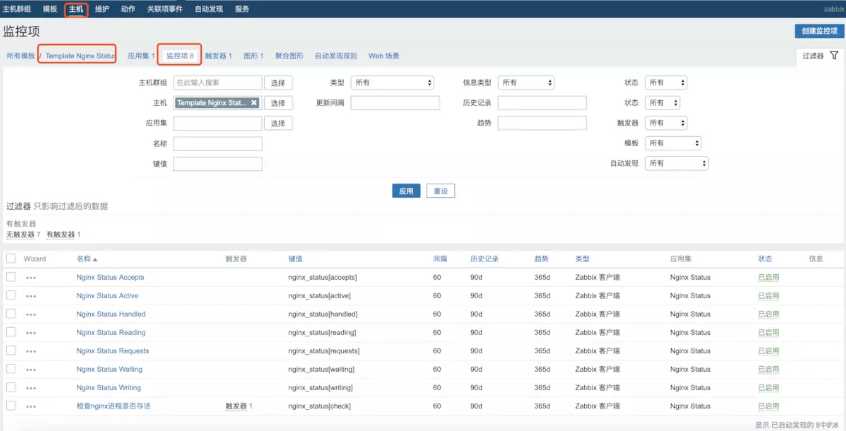

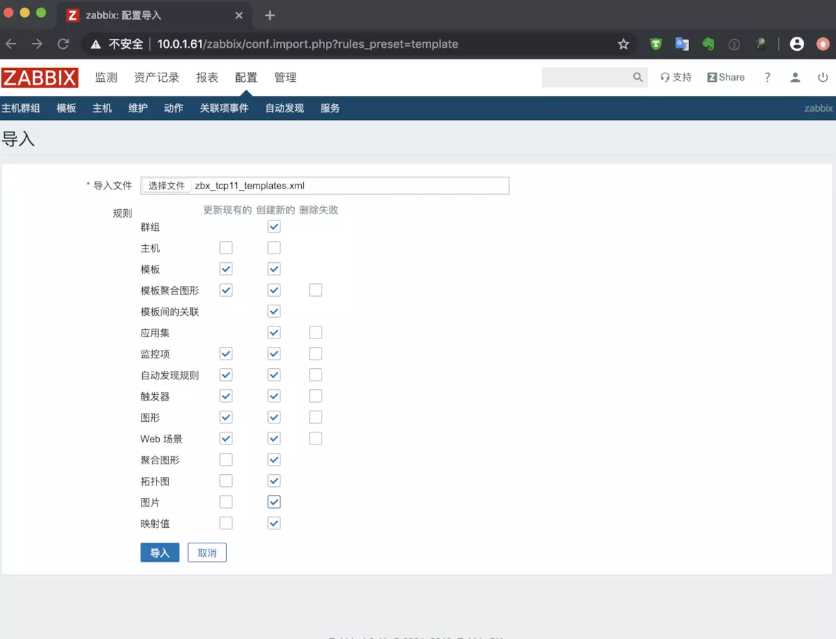
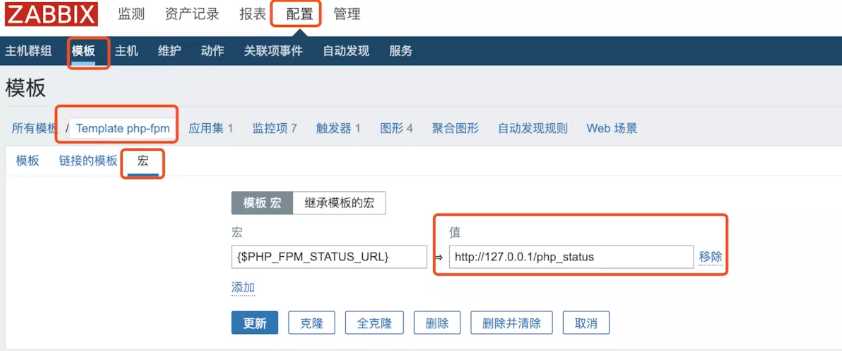
[root@web01 ~]# tail -1 /etc/php-fpm.d/www.conf pm.status_path = /php_status[root@web01 ~]# cat /etc/nginx/conf.d/status.conf server { listen 80; server_name localhost; location /nginx_status { stub_status on; access_log off; } location /php_status { fastcgi_pass 127.0.0.1:9000; fastcgi_index index.php; fastcgi_param SCRIPT_FILENAME html$fastcgi_script_name; include fastcgi_params; }}[root@web01 ~]# nginx -tnginx: the configuration file /etc/nginx/nginx.conf syntax is oknginx: configuration file /etc/nginx/nginx.conf test is successful[root@web01 ~]# systemctl restart nginx.service php-fpm.service[root@web01 ~]# curl 127.0.0.1/php_statuspool: wwwprocess manager: dynamicstart time: 08/Aug/2019:22:31:27 +0800start since: 37accepted conn: 1listen queue: 0max listen queue: 0listen queue len: 128idle processes: 4active processes: 1total processes: 5max active processes: 1max children reached: 0slow requests: 0[root@web01 ~]# cat /etc/zabbix/zabbix_agentd.d/fpm.sh #!/bin/bash################################### Zabbix monitoring script## php-fpm:# - anything available via FPM status page#################################### Contact:# vincent.viallet@gmail.com################################### ChangeLog:# 20100922 VV initial creation################################### Zabbix requested parameterZBX_REQ_DATA="$1"ZBX_REQ_DATA_URL="$2"# Nginx defaultsNGINX_STATUS_DEFAULT_URL="http://localhost/fpm/status"WGET_BIN="/usr/bin/wget"## Error handling:# - need to be displayable in Zabbix (avoid NOT_SUPPORTED)# - items need to be of type "float" (allow negative + float)#ERROR_NO_ACCESS_FILE="-0.91"ERROR_NO_ACCESS="-0.92"ERROR_WRONG_PARAM="-0.93"ERROR_DATA="-0.94" # either can not connect / bad host / bad port# Handle host and port if non-defaultif [ ! -z "$ZBX_REQ_DATA_URL" ]; then URL="$ZBX_REQ_DATA_URL"else URL="$NGINX_STATUS_DEFAULT_URL"fi# save the nginx stats in a variable for future parsingNGINX_STATS=$($WGET_BIN -q $URL -O - 2>/dev/null)# error during retrieveif [ $? -ne 0 -o -z "$NGINX_STATS" ]; then echo $ERROR_DATA exit 1fi# # Extract data from nginx stats##RESULT=$(echo "$NGINX_STATS" | awk 'print $0;match($0, "^'"$ZBX_REQ_DATA"':[[:space:]]+(.*)", a) { print a[1] }')#RESULT=$(echo "$NGINX_STATS" | grep "$ZBX_REQ_DATA" | awk -F : '{print $2}')RESULT=$(echo "$NGINX_STATS" | awk -F : "{if(\$1==\"$ZBX_REQ_DATA\") print \$2}")if [ $? -ne 0 -o -z "$RESULT" ]; then echo $ERROR_WRONG_PARAM exit 1fiecho $RESULTexit 0[root@web01 ~]# bash /etc/zabbix/zabbix_agentd.d/fpm.sh "total processes" http://127.0.0.1/php_status5[root@web01 ~]# cat /etc/zabbix/zabbix_agentd.d/fpm.conf UserParameter=php-fpm[*],/etc/zabbix/zabbix_agentd.d/fpm.sh "$1" "$2"[root@web01 ~]# systemctl restart zabbix-agent.service[root@m01 ~]# zabbix_get -s 10.0.1.7 -k php-fpm["total processes",http://127.0.0.1/php_status]5导入之后需要修改一下模版里的宏配置
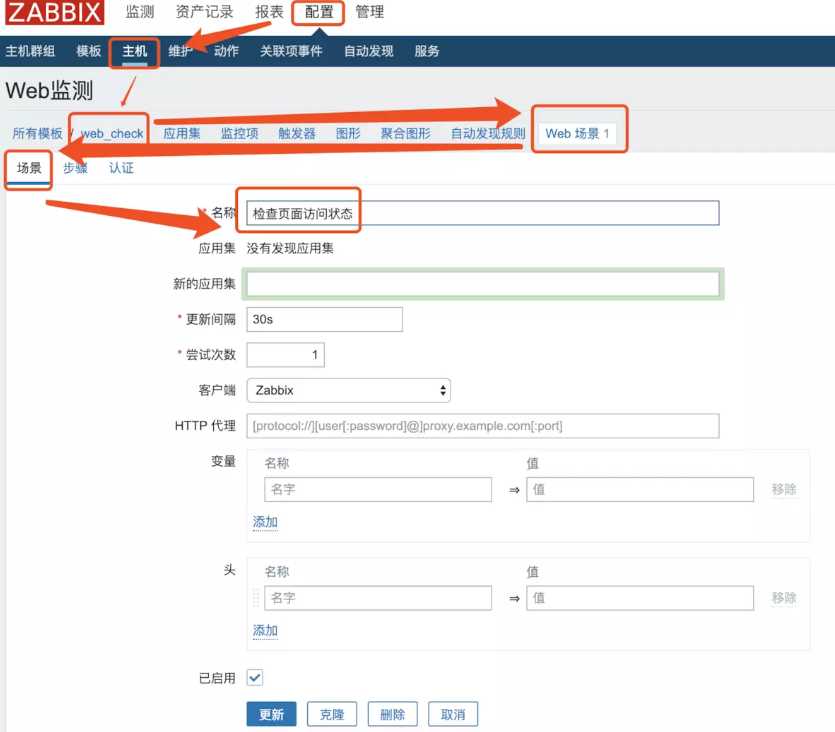
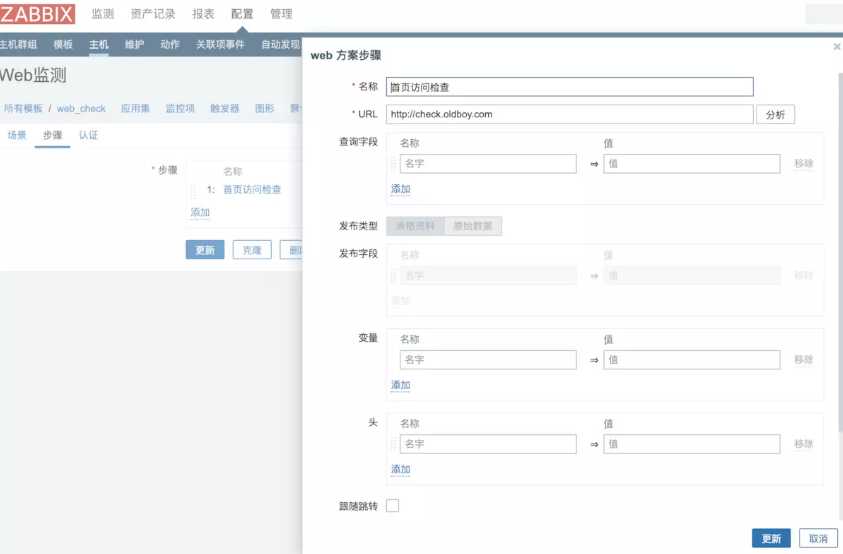
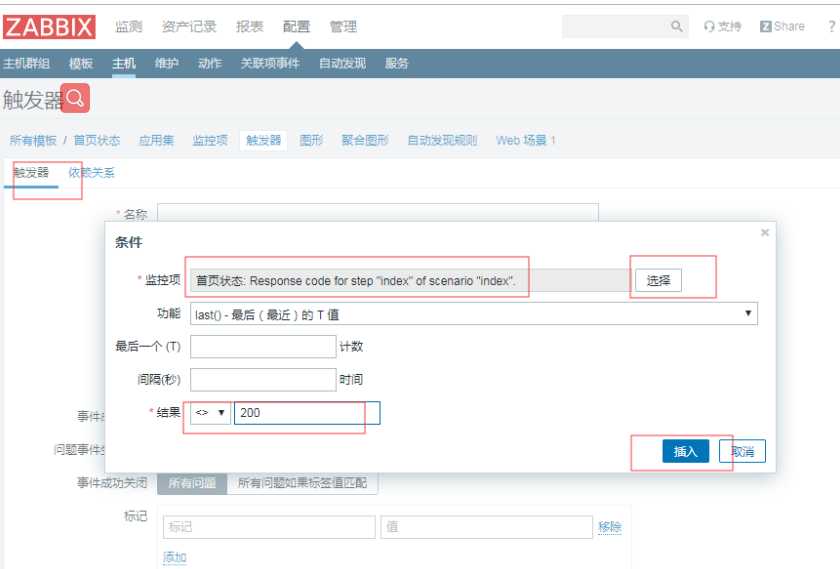
需求,监控页面状态码

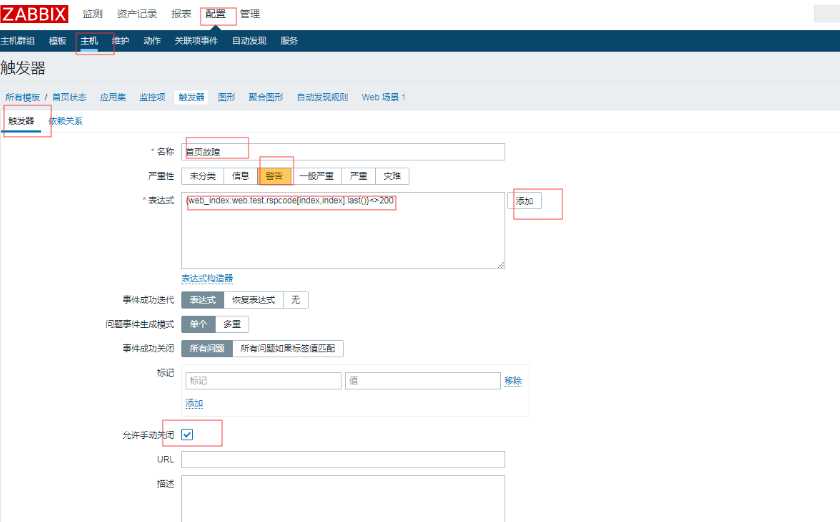
创建触发器
停掉服务时
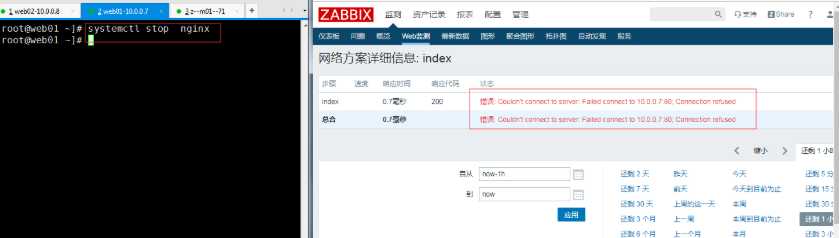
启动服务

故障现象:
提示zabbix-server is not running

报错日志:
34983:20190807:202215.171 database is down: reconnecting in 10 seconds 34983:20190807:202225.172 [Z3001] connection to database 'zabbix' failed: [1045] Access denied for user 'zabbix'@'localhost' (using password: NO)故障原因:
zabbix-server的配置文件里配有配置数据库密码
故障解决:
添加正确的数据库账号密码信息
[root@m01 ~]# grep "^DB" /etc/zabbix/zabbix_server.conf DBHost=localhostDBName=zabbixDBUser=zabbixDBPassword=zabbix故障现象:微信报警失败
报错日志:
[root@m01 ~]# tail -f /var/log/zabbix/zabbix_server.log Problem name: TIME_WAIT过多Host: web01Severity: AverageOriginal problem ID: 51'": Traceback (most recent call last): File "/usr/lib/zabbix/alertscripts/weixin.py", line 7, in <module> import requestsImportError: No module named requests问题原因:
缺少模块 requests
问题解决:
安装缺失的依赖包
[root@m01 ~]# yum install python-pip[root@m01 ~]# pip install --upgrade pip[root@m01 ~]# pip install requests故障现象:
在server端使用zabbix_get命令测试键值命令时提示警告
[root@m01 ~]# zabbix_get -s 10.0.1.7 -k ESTABLISHED (Not all processes could be identified, non-owned process info will not be shown, you would have to be root to see it all.)2问题原因:
zabbix_agent是以普通用户zabbix运行的,而普通用户执行netstat -antp时会有警告,网上查找发现只要不是用p参数就可以以普通用户运行
解决方案:
监控脚本里的命令修改为netstat -ant