理解问题
客户细分需要解决的问题是按照客户之间的相似特征区分不同客户群体。这个问题的先决条件中没有可供使用的客户分类列表,只有客户的人物画像。
数据集
已有的数据是公司的历史商业活动记录以及客户的购买记录。
offer.csv:
Offer #,Campaign,Varietal,Minimum Qty (kg),Discount (%),Origin,Past Peak
1,January,Malbec,72,56,France,FALSE
2,January,Pinot Noir,72,17,France,FALSE
3,February,Espumante,144,32,Oregon,TRUE
4,February,Champagne,72,48,France,TRUE
5,February,Cabernet Sauvignon,144,44,New Zealand,TRUE
6,March,Prosecco,144,86,Chile,FALSE
7,March,Prosecco,6,40,Australia,TRUE
8,March,Espumante,6,45,South Africa,FALSE
9,April,Chardonnay,144,57,Chile,FALSE
10,April,Prosecco,72,52,California,FALSE
11,May,Champagne,72,85,France,FALSE
12,May,Prosecco,72,83,Australia,FALSE
13,May,Merlot,6,43,Chile,FALSE
14,June,Merlot,72,64,Chile,FALSE
15,June,Cabernet Sauvignon,144,19,Italy,FALSE
16,June,Merlot,72,88,California,FALSE
17,July,Pinot Noir,12,47,Germany,FALSE
18,July,Espumante,6,50,Oregon,FALSE
19,July,Champagne,12,66,Germany,FALSE
20,August,Cabernet Sauvignon,72,82,Italy,FALSE
21,August,Champagne,12,50,California,FALSE
22,August,Champagne,72,63,France,FALSE
23,September,Chardonnay,144,39,South Africa,FALSE
24,September,Pinot Noir,6,34,Italy,FALSE
25,October,Cabernet Sauvignon,72,59,Oregon,TRUE
26,October,Pinot Noir,144,83,Australia,FALSE
27,October,Champagne,72,88,New Zealand,FALSE
28,November,Cabernet Sauvignon,12,56,France,TRUE
29,November,Pinot Grigio,6,87,France,FALSE
30,December,Malbec,6,54,France,FALSE
31,December,Champagne,72,89,France,FALSE
32,December,Cabernet Sauvignon,72,45,Germany,TRUE
transaction.csv:
Customer Last Name,Offer #
Smith,2
Smith,24
Johnson,17
Johnson,24
Johnson,26
Williams,18
Williams,22
Williams,31
Brown,7
Brown,29
Brown,30
Jones,8
Miller,6
Miller,10
Miller,14
Miller,15
Miller,22
Miller,23
Miller,31
Davis,12
Davis,22
Davis,25
Garcia,14
Garcia,15
Rodriguez,2
Rodriguez,26
Wilson,8
Wilson,30
Martinez,12
Martinez,25
Martinez,28
Anderson,24
Anderson,26
Taylor,7
Taylor,18
Taylor,29
Taylor,30
Thomas,1
Thomas,4
Thomas,9
Thomas,11
Thomas,14
Thomas,26
Hernandez,28
Hernandez,29
Moore,17
Moore,24
Martin,2
Martin,11
Martin,28
Jackson,1
Jackson,2
Jackson,11
Jackson,15
Jackson,22
Thompson,9
Thompson,16
Thompson,25
Thompson,30
White,14
White,22
White,25
White,30
Lopez,9
Lopez,11
Lopez,15
Lopez,16
Lopez,27
Lee,3
Lee,4
Lee,6
Lee,22
Lee,27
Gonzalez,9
Gonzalez,31
Harris,4
Harris,6
Harris,7
Harris,19
Harris,22
Harris,27
Clark,4
Clark,11
Clark,28
Clark,31
Lewis,7
Lewis,8
Lewis,30
Robinson,7
Robinson,29
Walker,18
Walker,29
Perez,18
Perez,30
Hall,11
Hall,22
Young,6
Young,9
Young,15
Young,22
Young,31
Young,32
Allen,9
Allen,27
Sanchez,4
Sanchez,5
Sanchez,14
Sanchez,15
Sanchez,20
Sanchez,22
Sanchez,26
Wright,4
Wright,6
Wright,21
Wright,27
King,7
King,13
King,18
King,29
Scott,6
Scott,14
Scott,23
Green,7
Baker,7
Baker,10
Baker,19
Baker,31
Adams,18
Adams,29
Adams,30
Nelson,3
Nelson,4
Nelson,8
Nelson,31
Hill,8
Hill,13
Hill,18
Hill,30
Ramirez,9
Campbell,2
Campbell,24
Campbell,26
Mitchell,1
Mitchell,2
Roberts,31
Carter,7
Carter,13
Carter,29
Carter,30
Phillips,17
Phillips,24
Evans,22
Evans,27
Turner,4
Turner,6
Turner,27
Turner,31
Torres,8
Parker,11
Parker,16
Parker,20
Parker,29
Parker,31
Collins,11
Collins,30
Edwards,8
Edwards,27
Stewart,8
Stewart,29
Stewart,30
Flores,17
Flores,24
Morris,17
Morris,24
Morris,26
Nguyen,19
Nguyen,31
Murphy,7
Murphy,12
Rivera,7
Rivera,18
Cook,24
Cook,26
Rogers,3
Rogers,7
Rogers,8
Rogers,19
Rogers,21
Rogers,22
Morgan,8
Morgan,29
Peterson,1
Peterson,2
Peterson,10
Peterson,23
Peterson,26
Peterson,27
Cooper,4
Cooper,16
Cooper,20
Cooper,32
Reed,5
Reed,14
Bailey,7
Bailey,30
Bell,2
Bell,17
Bell,24
Bell,26
Gomez,11
Gomez,20
Gomez,25
Gomez,32
Kelly,6
Kelly,20
Kelly,31
Kelly,32
Howard,11
Howard,12
Howard,22
Ward,4
Cox,2
Cox,17
Cox,24
Cox,26
Diaz,7
Diaz,8
Diaz,29
Diaz,30
Richardson,3
Richardson,6
Richardson,22
Wood,1
Wood,10
Wood,14
Wood,31
Watson,7
Watson,29
Brooks,3
Brooks,8
Brooks,11
Brooks,22
Bennett,8
Bennett,29
Gray,12
Gray,16
Gray,26
James,7
James,8
James,13
James,18
James,30
Reyes,9
Reyes,23
Cruz,29
Cruz,30
Hughes,7
Hughes,8
Hughes,13
Hughes,29
Hughes,30
Price,1
Price,22
Price,30
Price,31
Myers,18
Myers,30
Long,3
Long,7
Long,10
Foster,1
Foster,9
Foster,14
Foster,22
Foster,23
Sanders,1
Sanders,4
Sanders,5
Sanders,6
Sanders,9
Sanders,11
Sanders,20
Sanders,25
Sanders,26
Ross,18
Ross,21
Morales,6
Morales,7
Morales,8
Morales,19
Morales,22
Morales,31
Powell,5
Sullivan,8
Sullivan,13
Sullivan,18
Russell,26
Ortiz,8
Jenkins,24
Jenkins,26
Gutierrez,6
Gutierrez,8
Gutierrez,10
Gutierrez,18
Perry,8
Perry,18
Perry,29
Perry,30
Butler,1
Butler,4
Butler,22
Butler,28
Butler,30
Barnes,10
Barnes,21
Barnes,22
Barnes,31
Fisher,1
Fisher,2
Fisher,11
Fisher,22
Fisher,28
Fisher,30
Fisher,31
预处理
需要对两个数据集做关联处理,这样才能得到单一的视图。同时由于需要比较客户所产生的交易,还需要建立一张透视表。行代表客户,列代表商业活动,单元格值则显示是否客户有购买行为。
var offers = Offer.ReadFromCsv(_offersCsv);
var transactions = Transaction.ReadFromCsv(_transactionsCsv);

var clusterData = (from of in offers
                   join tr in transactions on of.OfferId equals tr.OfferId
                   select new
                   {
                       of.OfferId,
                       of.Campaign,
                       of.Discount,
                       tr.LastName,
                       of.LastPeak,
                       of.Minimum,
                       of.Origin,
                       of.Varietal,
                       Count = 1,
                   }).ToArray();

var count = offers.Count();
var pivotDataArray =
    (from c in clusterData
     group c by c.LastName into gcs
     let lookup = gcs.ToLookup(y => y.OfferId, y => y.Count)
     select new PivotData()
     {
         LastName = gcs.Key,
         Features = ToFeatures(lookup, count)
}).ToArray();ToFeatures方法依据商业活动的数量,生成所需的特征数组。
private static float[] ToFeatures(ILookup<string, int> lookup, int count)
{
    var result = new float[count];
    foreach (var item in lookup)
    {
        var key = Convert.ToInt32(item.Key) - 1;
        result[key] = item.Sum();
    }

    return result;
}
数据视图
取得用于生成视图的数组后,这里使用CreateStreamingDataView方法构建数据视图。而又因为Features属性是一个数组,所以必须声明其大小。
var mlContext = new MLContext();

var schemaDef = SchemaDefinition.Create(typeof(PivotData));
schemaDef["Features"].ColumnType = new VectorType(NumberType.R4, count);

var pivotDataView = mlContext.CreateStreamingDataView(pivotDataArray, schemaDef);
PCA
PCA(principal Component Analysis),主成分分析,是为了将过多的维度值减少至一个合适的范围以便于分析,这里是降到二维空间。
new PrincipalComponentAnalysisEstimator(mlContext, "Features", "PCAFeatures", rank: 2)OneHotEncoding
One Hot Encoding在此处的作用是将LastName从字符串转换为数字矩阵。
new OneHotEncodingEstimator(mlContext, new[] { new OneHotEncodingEstimator.ColumnInfo("LastName", "LastNameKey", OneHotEncodingTransformer.OutputKind.Ind) })训练器
K-Means是常用的应对聚类问题的训练器,这里假设要分为三类。
mlContext.Clustering.Trainers.KMeans("Features", clustersCount: 3)训练模型
trainingPipeline.Fit(pivotDataView);评估模型
var predictions = trainedModel.Transform(pivotDataView);
var metrics = mlContext.Clustering.Evaluate(predictions, score: "Score", features: "Features");

Console.WriteLine($"*************************************************");
Console.WriteLine($"*       Metrics for {trainer} clustering model      ");
Console.WriteLine($"*------------------------------------------------");
Console.WriteLine($"*       AvgMinScore: {metrics.AvgMinScore}");
Console.WriteLine($"*       DBI is: {metrics.Dbi}");
Console.WriteLine($"*************************************************");
可得到如下的评估结果。
*************************************************
*       Metrics for Microsoft.ML.Trainers.KMeans.KMeansPlusPlusTrainer clustering model
*------------------------------------------------
*       AvgMinScore: 2.3154067927599
*       DBI is: 2.69100740819456
*************************************************
使用模型
var clusteringPredictions = predictions
.AsEnumerable<ClusteringPrediction>(mlContext, false)
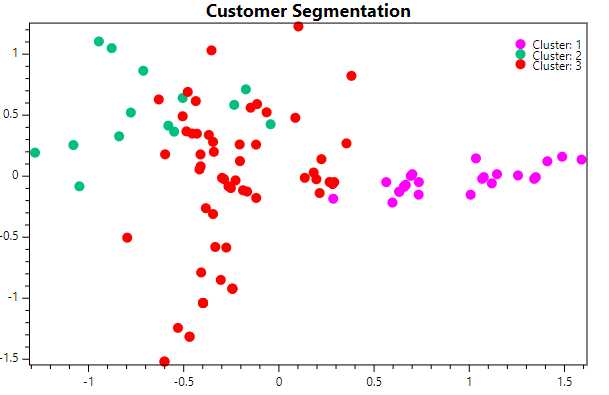
.ToArray();画图
为了更直观地观察,可以用OxyPlot类库生成结果图片。
添加类库:
dotnet add package OxyPlot.CorePlot生成处理:
var plot = new PlotModel { Title = "Customer Segmentation", IsLegendVisible = true };

var clusters = clusteringPredictions.Select(p => p.SelectedClusterId).Distinct().OrderBy(x => x);

foreach (var cluster in clusters)
{
    var scatter = new ScatterSeries { MarkerType = MarkerType.Circle, MarkerStrokeThickness = 2, Title = $"Cluster: {cluster}", RenderInLegend = true };
    var series = clusteringPredictions
        .Where(p => p.SelectedClusterId == cluster)
        .Select(p => new ScatterPoint(p.Location[0], p.Location[1])).ToArray();
    scatter.Points.AddRange(series);
    plot.Series.Add(scatter);
}

plot.DefaultColors = OxyPalettes.HueDistinct(plot.Series.Count).Colors;

var exporter = new SvgExporter { Width = 600, Height = 400 };
using (var fs = new System.IO.FileStream(_plotSvg, System.IO.FileMode.Create))
{
    exporter.Export(plot, fs);
}
最后的图片如下所示:

完整示例代码
Program类:
using CustomerSegmentation.DataStructures;
using Microsoft.ML;
using System;
using System.IO;
using System.Linq;
using Microsoft.ML.Runtime.Api;
using Microsoft.ML.Transforms.Projections;
using Microsoft.ML.Transforms.Categorical;
using Microsoft.ML.Runtime.Data;
using OxyPlot;
using OxyPlot.Series;
using Microsoft.ML.Core.Data;

namespace CustomerSegmentation
{
    class Program
    {
        private static float[] ToFeatures(ILookup<string, int> lookup, int count)
        {
            var result = new float[count];
            foreach (var item in lookup)
            {
                var key = Convert.ToInt32(item.Key) - 1;
                result[key] = item.Sum();
            }

            return result;
        }

        static readonly string _offersCsv = Path.Combine(Environment.CurrentDirectory, "assets", "offers.csv");
        static readonly string _transactionsCsv = Path.Combine(Environment.CurrentDirectory, "assets", "transactions.csv");
        static readonly string _plotSvg = Path.Combine(Environment.CurrentDirectory, "assets", "customerSegmentation.svg");

        static void Main(string[] args)
        {
            var offers = Offer.ReadFromCsv(_offersCsv);
            var transactions = Transaction.ReadFromCsv(_transactionsCsv);

            var clusterData = (from of in offers
                               join tr in transactions on of.OfferId equals tr.OfferId
                               select new
                               {
                                   of.OfferId,
                                   of.Campaign,
                                   of.Discount,
                                   tr.LastName,
                                   of.LastPeak,
                                   of.Minimum,
                                   of.Origin,
                                   of.Varietal,
                                   Count = 1,
                               }).ToArray();

            var count = offers.Count();
            var pivotDataArray =
                (from c in clusterData
                 group c by c.LastName into gcs
                 let lookup = gcs.ToLookup(y => y.OfferId, y => y.Count)
                 select new PivotData()
                 {
                     LastName = gcs.Key,
                     Features = ToFeatures(lookup, count)
                 }).ToArray();

            var mlContext = new MLContext();

            var schemaDef = SchemaDefinition.Create(typeof(PivotData));
            schemaDef["Features"].ColumnType = new VectorType(NumberType.R4, count);

            var pivotDataView = mlContext.CreateStreamingDataView(pivotDataArray, schemaDef);

            var dataProcessPipeline = new PrincipalComponentAnalysisEstimator(mlContext, "Features", "PCAFeatures", rank: 2)
                                .Append(new OneHotEncodingEstimator(mlContext,
                                new[] { new OneHotEncodingEstimator.ColumnInfo("LastName", "LastNameKey", OneHotEncodingTransformer.OutputKind.Ind) }));

            var trainer = mlContext.Clustering.Trainers.KMeans("Features", clustersCount: 3);
            var trainingPipeline = dataProcessPipeline.Append(trainer);

            ITransformer trainedModel = trainingPipeline.Fit(pivotDataView);

            var predictions = trainedModel.Transform(pivotDataView);
            var metrics = mlContext.Clustering.Evaluate(predictions, score: "Score", features: "Features");

            Console.WriteLine($"*************************************************");
            Console.WriteLine($"*       Metrics for {trainer} clustering model      ");
            Console.WriteLine($"*------------------------------------------------");
            Console.WriteLine($"*       AvgMinScore: {metrics.AvgMinScore}");
            Console.WriteLine($"*       DBI is: {metrics.Dbi}");
            Console.WriteLine($"*************************************************");

            var clusteringPredictions = predictions
                .AsEnumerable<ClusteringPrediction>(mlContext, false)
                .ToArray();

            var plot = new PlotModel { Title = "Customer Segmentation", IsLegendVisible = true };

            var clusters = clusteringPredictions.Select(p => p.SelectedClusterId).Distinct().OrderBy(x => x);

            foreach (var cluster in clusters)
            {
                var scatter = new ScatterSeries { MarkerType = MarkerType.Circle, MarkerStrokeThickness = 2, Title = $"Cluster: {cluster}", RenderInLegend = true };
                var series = clusteringPredictions
                    .Where(p => p.SelectedClusterId == cluster)
                    .Select(p => new ScatterPoint(p.Location[0], p.Location[1])).ToArray();
                scatter.Points.AddRange(series);
                plot.Series.Add(scatter);
            }

            plot.DefaultColors = OxyPalettes.HueDistinct(plot.Series.Count).Colors;

            var exporter = new SvgExporter { Width = 600, Height = 400 };
            using (var fs = new System.IO.FileStream(_plotSvg, System.IO.FileMode.Create))
            {
                exporter.Export(plot, fs);
            }

            Console.Read();
        }
    }
}
Offer类:
using System.Collections.Generic;
using System.IO;
using System.Linq;

namespace CustomerSegmentation.DataStructures
{
    public class Offer
    {
        //Offer #,Campaign,Varietal,Minimum Qty (kg),Discount (%),Origin,Past Peak
        public string OfferId { get; set; }
        public string Campaign { get; set; }
        public string Varietal { get; set; }
        public float Minimum { get; set; }
        public float Discount { get; set; }
        public string Origin { get; set; }
        public string LastPeak { get; set; }

        public static IEnumerable<Offer> ReadFromCsv(string file)
        {
            return File.ReadAllLines(file)
             .Skip(1) // skip header
             .Select(x => x.Split(‘,‘))
             .Select(x => new Offer()
             {
                 OfferId = x[0],
                 Campaign = x[1],
                 Varietal = x[2],
                 Minimum = float.Parse(x[3]),
                 Discount = float.Parse(x[4]),
                 Origin = x[5],
                 LastPeak = x[6]
             });
        }
    }
}
Transaction类:
using System.Collections.Generic;
using System.IO;
using System.Linq;

namespace CustomerSegmentation.DataStructures
{
    public class Transaction
    {
        //Customer Last Name,Offer #
        //Smith,2
        public string LastName { get; set; }
        public string OfferId { get; set; }

        public static IEnumerable<Transaction> ReadFromCsv(string file)
        {
            return File.ReadAllLines(file)
             .Skip(1) // skip header
             .Select(x => x.Split(‘,‘))
             .Select(x => new Transaction()
             {
                 LastName = x[0],
                 OfferId = x[1],
             });
        }
    }
}
PivotData类:
namespace CustomerSegmentation.DataStructures
{
    public class PivotData
    {
        public float[] Features;
        public string LastName;
    }
}
ClusteringPrediction类:
using Microsoft.ML.Runtime.Api;
using System;
using System.Collections.Generic;
using System.Text;

namespace CustomerSegmentation.DataStructures
{
    public class ClusteringPrediction
    {
        [ColumnName("PredictedLabel")]
        public uint SelectedClusterId;
        [ColumnName("Score")]
        public float[] Distance;
        [ColumnName("PCAFeatures")]
        public float[] Location;
        [ColumnName("LastName")]
        public string LastName;
    }
}