一、官网
官网: http://www.echartsjs.com/
上手:http://www.echartsjs.com/tutorial.html#5%20%E5%88%86%E9%92%9F%E4%B8%8A%E6%89%8B%20ECharts
二、例子
实例:

1. 先引入:echarts.common.min.js /或者: echarts.js
1 <head>
2     <meta charset="utf-8">
3     <title>ECharts</title>
4      <script src="echarts.common.min.js"></script>
5 </head>
2. 为ECharts准备一个具备大小的DIV容器
<body>
    <!-- 为ECharts准备一个具备大小(宽高)的Dom -->
    <div id="main" style="width: 600px;height:400px;"></div>
</body>
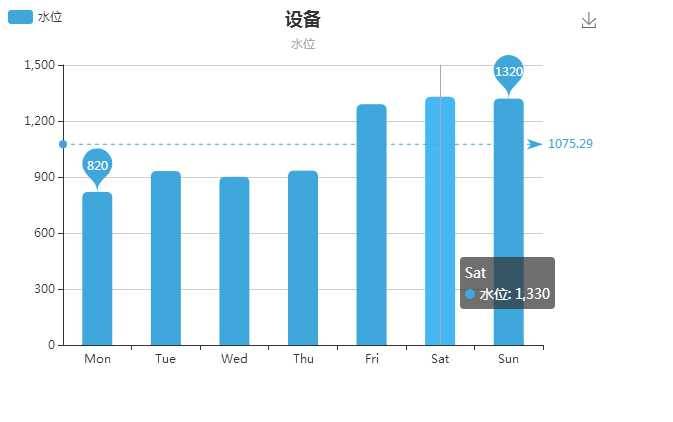
3. js:设置参数初始化图表
 1 <script>
 2     window.onload = function () { loadChasrt() };
 3     function loadChasrt() {
 4         // 基于准备好的dom,初始化echarts实例
 5         var myChart = echarts.init(document.getElementById(‘main‘));
 6
 7         // 指定图表的配置项和数据
 8         var nameDevice = ‘设备‘, barName = ‘水位‘, X = [‘Mon‘, ‘Tue‘, ‘Wed‘, ‘Thu‘, ‘Fri‘, ‘Sat‘, ‘Sun‘],
 9     dataValue = [820, 932, 901, 934, 1290, 1330, 1320];
10         var yMax = 1320;
11         var xMax = 6;
12         var yMin = 820;
13         var xMin = 0;
14         var option = {
15             title: {
16                 text: nameDevice,
17                 subtext: barName, x: ‘center‘, y: ‘top‘
18             },
19             tooltip: {
20                 trigger: ‘axis‘
21             },
22             legend: {
23                 data: [barName], x: ‘left‘, y: ‘top‘
24             },
25             toolbox: {
26                 feature: {
27                     saveAsImage: {}
28                 }
29             },
30             calculable: true,
31             xAxis: [
32                 {
33                     type: ‘category‘,
34                     data: X
35                 }
36             ],
37             yAxis: [
38                 {
39                     type: ‘value‘
40                 }
41             ],
42             series: [
43                 {
44                     name: barName,
45                     barWidth: 30,
46                     itemStyle: {
47                         normal: {
48                             color: ‘#3FA7DC‘,
49                             barBorderRadius: [6, 6, 0, 0]
50                         }
51                     },
52                     type: ‘bar‘,
53                     data: dataValue,
54                     markPoint: {
55                         data: [
56                             { name: ‘最高‘, value: yMax, xAxis: xMax, yAxis: yMax },
57                             { name: ‘最低‘, value: yMin, xAxis: xMin, yAxis: yMin }
58                         ]
59                     }
60                     , markLine: {
61                         data: [
62                             { type: ‘average‘, name: ‘平均值‘ }
63                         ]
64                     }
65                 }
66             ]
67         };
68
69
70         // 使用刚指定的配置项和数据显示图表。
71         myChart.setOption(option);
72     }
73
74
75
76 </script>
三、测试使用
在官网->实例里面编辑数据参数,查看网页效果
//折线图:


 1 var nameDevice = ‘设备‘,
 2     barName = ‘水位‘,
 3     X =  [‘周一‘,‘周二‘,‘周三‘,‘周四‘,‘周五‘,‘周六‘,‘周日‘],
 4     dataValue = [820, 932, 901, 934, 1290, 1330, 1320];
 5
 6 option = {
 7     title: {
 8         text: nameDevice,
 9         subtext: barName,
10         x: ‘center‘,
11         y: ‘top‘
12     },
13     tooltip: {
14         trigger: ‘axis‘,
15         axisPointer: {
16             type: ‘cross‘,
17             label: {
18                 backgroundColor: ‘#6a7985‘
19             }
20         }
21     },
22     legend: {
23         data: [barName],
24         x: ‘left‘,
25         y: ‘top‘
26     },
27     toolbox: {
28         feature: {
29             saveAsImage: {}
30         }
31     },
32     calculable: true,
33
34
35     xAxis: {
36         type: ‘category‘,
37         boundaryGap: false,
38         data: X
39     },
40     yAxis: {
41         type: ‘value‘
42     },
43     series: [{
44         name: barName,
45          type: ‘line‘,
46           data: dataValue,
47         areaStyle: {
48             normal: {
49                 color: {
50                     type: ‘linear‘,
51                     x: 0,
52                     y: 0,
53                     x2: 0,
54                     y2: 1,
55                     colorStops: [{
56                         offset: 0,
57                         color: ‘rgba(88,160,253,1)‘
58                     }, {
59                         offset: 0.5,
60                         color: ‘rgba(88,160,253,0.7)‘
61                     }, {
62                         offset: 1,
63                         color: ‘rgba(88,160,253,0)‘
64                     }]
65                 }
66             }
67         },
68         lineStyle: {
69             normal: {
70                 color: ‘rgba(88,160,253,1)‘
71             }
72         },
73         itemStyle: {
74             normal: {
75                 color: ‘rgba(88,160,253,1)‘
76             }
77         }
78     }]
79 };
View Code
 1 var nameDevice = ‘设备‘,
 2     barName = ‘水位‘,
 3     X = [‘周一‘, ‘周二‘, ‘周三‘, ‘周四‘, ‘周五‘, ‘周六‘, ‘周日‘],
 4     dataValue = [820, 932, 901, 934, 1290, 1330, 1320];
 5
 6 option = {
 7     title: {
 8         text: ‘折线图堆叠‘
 9     },
10     tooltip: {
11         trigger: ‘axis‘
12     },
13     legend: {
14         data: [‘邮件营销‘, barName, ‘视频广告‘, ‘直接访问‘, ‘搜索引擎‘]
15     },
16     grid: {
17         left: ‘3%‘,
18         right: ‘4%‘,
19         bottom: ‘3%‘,
20         containLabel: true
21     },
22     toolbox: {
23         feature: {
24             saveAsImage: {}
25         }
26     },
27     xAxis: {
28         type: ‘category‘,
29         boundaryGap: false,
30         data: [‘周一‘, ‘周二‘, ‘周三‘, ‘周四‘, ‘周五‘, ‘周六‘, ‘周日‘]
31     },
32     yAxis: {
33         type: ‘value‘
34     },
35     series: [{
36             name: ‘邮件营销‘,
37             type: ‘line‘,
38             stack: ‘总量‘,
39             data: [120, 132, 101, 134, 90, 230, 210]
40         },
41         {
42             name: barName,
43             type: ‘line‘,
44             stack: ‘总量‘,
45             data: dataValue,
46             areaStyle: {
47                normal: {
48                     color: {
49                         type: ‘linear‘,
50                         x: 0,
51                         y: 0,
52                         x2: 0,
53                         y2: 1,
54                         colorStops: [{
55                             offset: 0,
56                             color: ‘rgba(88,160,253,1)‘
57                         }, {
58                             offset: 0.5,
59                             color: ‘rgba(88,160,253,0.7)‘
60                         }, {
61                             offset: 1,
62                             color: ‘rgba(88,160,253,0)‘
63                         }]
64                     }
65                 }
66             },
67             lineStyle: {
68                 normal: {
69                     color: ‘rgba(88,160,253,1)‘
70                 }
71             },
72             itemStyle: {
73                 normal: {
74                     color: ‘rgba(88,160,253,1)‘
75                 }
76             }
77         },
78         {
79             name: ‘视频广告‘,
80             type: ‘line‘,
81             stack: ‘总量‘,
82             data: [150, 232, 201, 154, 190, 330, 410]
83         },
84         {
85             name: ‘直接访问‘,
86             type: ‘line‘,
87             stack: ‘总量‘,
88             data: [320, 332, 301, 334, 390, 330, 320]
89         },
90         {
91             name: ‘搜索引擎‘,
92             type: ‘line‘,
93             stack: ‘总量‘,
94             data: [820, 932, 901, 934, 1290, 1330, 1320]
95         }
96     ]
97 };
View Code
//添加bar:柱状图
  1 app.title = ‘多 Y 轴示例‘;
  2 var colors = [‘#5793f3‘, ‘#d14a61‘, ‘#675bba‘];
  3   // 指定图表的配置项和数据
  4     var nameDevice = ‘设备‘, barName = ‘水位‘, X = [‘Mon‘, ‘Tue‘, ‘Wed‘, ‘Thu‘, ‘Fri‘, ‘Sat‘, ‘Sun‘],
  5 dataValue = [820, 932, 901, 934, 1290, 1330, 1320];
  6     var yMax = 1320;
  7     var xMax = 6;
  8     var yMin = 820;
  9     var xMin = 0;
 10 option = {
 11     color: colors,
 12
 13     tooltip: {
 14         trigger: ‘axis‘,
 15         axisPointer: {
 16             type: ‘cross‘
 17         }
 18     },
 19     grid: {
 20         right: ‘20%‘
 21     },
 22     toolbox: {
 23         feature: {
 24             dataView: {show: true, readOnly: false},
 25             restore: {show: true},
 26             saveAsImage: {show: true}
 27         }
 28     },
 29     legend: {
 30         data:[‘蒸发量‘,‘降水量‘,‘平均温度‘]
 31     },
 32     xAxis: [
 33         {
 34             type: ‘category‘,
 35             axisTick: {
 36                 alignWithLabel: true
 37             },
 38             data: [‘1月‘,‘2月‘,‘3月‘,‘4月‘,‘5月‘,‘6月‘,‘7月‘ ]
 39         }
 40     ],
 41     yAxis: [
 42         {
 43             type: ‘value‘,
 44             name: ‘蒸发量‘,
 45             min: 0,
 46             max: 250,
 47             position: ‘right‘,
 48             axisLine: {
 49                 lineStyle: {
 50                     color: colors[0]
 51                 }
 52             },
 53             axisLabel: {
 54                 formatter: ‘{value} ml‘
 55             }
 56         },
 57         {
 58             type: ‘value‘,
 59             name: barName,
 60             min: 0,
 61             max: 250,
 62             position: ‘right‘,
 63             offset: 80,
 64             axisLine: {
 65                 lineStyle: {
 66                     color: colors[1]
 67                 }
 68             },
 69             axisLabel: {
 70                 formatter: ‘{value} ml‘
 71             }
 72         },
 73         {
 74             type: ‘value‘,
 75             name: ‘温度‘,
 76             min: 0,
 77             max: 25,
 78             position: ‘left‘,
 79             axisLine: {
 80                 lineStyle: {
 81                     color: colors[2]
 82                 }
 83             },
 84             axisLabel: {
 85                 formatter: ‘{value} °C‘
 86             }
 87         }
 88     ],
 89     series: [
 90         {
 91             name:‘蒸发量‘,
 92             type:‘line‘,
 93             data:[2.0, 4.9, 17.0, 23.2, 25.6, 76.7, 135.6 ]
 94         },
 95
 96
 97         {
 98             name: barName,
 99
100              barWidth: 30,
101                 itemStyle: {
102                     normal: {
103                         color: ‘#3FA7DC‘,
104                         barBorderRadius: [6, 6, 0, 0]
105                     }
106                 },
107                 type: ‘bar‘,
108                  markPoint: {
109                     data: [
110                         { name: ‘最高‘, value: yMax, xAxis: xMax, yAxis: yMax },
111                         { name: ‘最低‘, value: yMin, xAxis: xMin, yAxis: yMin }
112                     ]
113                 }
114                 ,
115             yAxisIndex: 1,
116             data:[2.6, 5.9, 9.0, 26.4, 228.7, 70.7, 175.6 ]
117         },
118         {
119             name:‘平均温度‘,
120             type:‘line‘,
121             yAxisIndex: 2,
122             data:[2.0, 2.2, 3.3, 4.5, 6.3, 10.2, 20.3 ]
123         }
124     ]
125 };
View Code
//混合多图:相同X刻度不同y变量类型的多图
  1 var ValueList = [{
  2         "value": [‘2010-10-01 19:00‘, 21]
  3     },
  4     {
  5         "value": [‘2010-10-03 19:00‘, 21]
  6     },
  7     {
  8         "value": [‘2010-10-04 19:00‘, 200]
  9     }, {
 10         "value": [‘2010-10-05 11:00‘, 2]
 11     },
 12     {
 13         "value": [‘2010-10-06 12:00‘, 21]
 14     },
 15     {
 16         "value": [‘2010-10-07 18:00‘, 21]
 17     }, {
 18         "value": [‘2010-10-09 09:00‘, 21]
 19     }
 20 ];
 21
 22 var aValueList = [{
 23         "value": [‘2010-10-01 19:00‘, 21]
 24     },
 25     {
 26         "value": [‘2010-10-03 19:00‘, 61]
 27     },
 28     {
 29         "value": [‘2010-10-04 19:00‘, 40]
 30     }, {
 31         "value": [‘2010-10-05 11:00‘, 41]
 32     },
 33     {
 34         "value": [‘2010-10-06 12:00‘, 61]
 35     },
 36     {
 37         "value": [‘2010-10-07 18:00‘, 61]
 38     }, {
 39         "value": [‘2010-10-09 09:00‘, 71]
 40     }
 41 ];
 42
 43 var bValueList = [{
 44         "value": [‘2010-10-01 19:00‘, 91]
 45     },
 46     {
 47         "value": [‘2010-10-03 19:00‘, 81]
 48     },
 49     {
 50         "value": [‘2010-10-04 19:00‘, 80]
 51     }, {
 52         "value": [‘2010-10-05 11:00‘, 1]
 53     },
 54     {
 55         "value": [‘2010-10-06 12:00‘, 51]
 56     },
 57     {
 58         "value": [‘2010-10-07 18:00‘, 11]
 59     }, {
 60         "value": [‘2010-10-09 09:00‘, 71]
 61     }
 62 ];;
 63 var objP = [{}];
 64 var m = 0;
 65 objP[m].yAxisIndex = 0;
 66 var sname = "",
 67     name = "";
 68  var listYaxis = [{
 69     type: "value",
 70     name: "y轴刻度01"
 71
 72 }, {
 73
 74     type: "value",
 75     name: "y轴刻度02"
 76
 77 }, {
 78
 79     type: "value",
 80     name: "3"
 81
 82 }];
 83
 84
 85 var yMax = 200;
 86 var xMax = 2;
 87 var yMin = 2;
 88 var xMin = 3;
 89
 90 // xAxis: {  type: ‘time‘ , splitLine: { show: false } },
 91 option = {
 92     title: {
 93         text: name,
 94         x: ‘center‘,
 95         y: ‘top‘
 96     },
 97     tooltip: {
 98         trigger: ‘axis‘
 99     },
100     legend: {
101         data: [],
102         x: ‘left‘,
103         y: ‘top‘,
104         right: 50,
105         type: ‘scroll‘
106     },
107     dataZoom: {
108         show: true,
109         start: 0
110     },
111     calculable: true,
112     color: [‘#3398DB‘],
113
114     grid: {
115         left: ‘0%‘,
116         right: ‘0%‘,
117         bottom: ‘0%‘,
118         containLabel: true
119     },
120     toolbox: {
121         y: ‘top‘,
122         right: 15,
123         top: -3,
124         feature: {
125             saveAsImage: {}
126         }
127     },
128
129     xAxis: {
130         type: ‘category‘,
131         itLine: {
132             show: false
133         }
134     },
135     yAxis: [{
136         type: ‘value‘
137     }],
138
139     series: []
140 };
141
142
143 //加载Y轴,并设定位置
144 option.yAxis = []
145 for (var y = 0; y < listYaxis.length; y++) {
146    option.yAxis.push(listYaxis[y])
147 }
148 option.grid.left = 10
149 if (listYaxis.length > 1) {
150     option.grid.right = ((option.yAxis.length - 2) * 30)
151 }
152
153
154 option.legend.data.push(sname + "-采集值")
155 option.series.push({
156     name: sname + "-采集值",
157     type: ‘line‘,
158     stack: ‘‘,
159     data: bValueList,
160     yAxisIndex: objP[m].yAxisIndex,
161     symbolSize: 0
162 })
163
164
165 option.legend.data.push(sname + "-水位")
166 option.series.push({
167     name: sname + "-水位",
168     type: ‘line‘,
169     stack: ‘‘,
170     data: aValueList,
171     yAxisIndex: objP[m].yAxisIndex,
172     symbolSize: 0,
173     areaStyle: {
174         normal: {
175             color: {
176                 type: ‘linear‘,
177                 x: 0,
178                 y: 0,
179                 x2: 0,
180                 y2: 1,
181                 colorStops: [{
182                     offset: 0,
183                     color: ‘rgba(88,160,253,1)‘
184                 }, {
185                     offset: 0.5,
186                     color: ‘rgba(88,160,253,0.7)‘
187                 }, {
188                     offset: 1,
189                     color: ‘rgba(88,160,253,0)‘
190                 }]
191             }
192         }
193     },
194     lineStyle: {
195         normal: {
196             color: ‘rgba(88,160,253,1)‘
197         }
198     },
199     itemStyle: {
200         normal: {
201             color: ‘rgba(88,160,253,1)‘
202         }
203     }
204 })
205
206
207
208
209 option.legend.data.push(sname + "-降雨量");
210 option.series.push({
211     name: sname + "-降雨量",
212     type: ‘bar‘,
213     itemStyle: {
214         normal: {
215             color: ‘#3FA7DC‘,
216             barBorderRadius: [6, 6, 0, 0]
217         }
218     },
219     stack: ‘‘,
220     barWidth: 30,
221     markPoint: {
222         data: [{
223                 name: ‘最高‘,
224                 value: yMax,
225                 xAxis: xMax,
226                 yAxis: yMax
227             },
228             {
229                 name: ‘最低‘,
230                 value: yMin,
231                 xAxis: xMin,
232                 yAxis: yMin
233             }
234         ]
235     },
236     data: ValueList,
237     yAxisIndex: objP[m].yAxisIndex,
238     symbolSize: 0
239
240 });
View Code
// X轴为时间:xAxis: { type: ‘time‘ …
  1 var ValueList = [{
  2         "value": [‘2010-09-29 01:00‘, 21]
  3     },
  4     {
  5         "value": [‘2010-10-03 05:00‘, 21]
  6     },
  7     {
  8         "value": [‘2010-10-04 08:00‘, 200]
  9     }, {
 10         "value": [‘2010-10-05 011:00‘, 2]
 11     },
 12     {
 13         "value": [‘2010-10-06 12:00‘, 21]
 14     },
 15     {
 16         "value": [‘2010-10-07 18:00‘, 21]
 17     }, {
 18         "value": [‘2010-10-09 09:00‘, 21]
 19     }
 20 ];
 21
 22 var aValueList = [{
 23         "value": [‘2010-10-01 07:00‘, 21]
 24     },
 25     {
 26         "value": [‘2010-10-03 09:00‘, 61]
 27     },
 28     {
 29         "value": [‘2010-10-04 11:00‘, 40]
 30     }, {
 31         "value": [‘2010-10-05 11:00‘, 41]
 32     },
 33     {
 34         "value": [‘2010-10-06 12:00‘, 61]
 35     },
 36     {
 37         "value": [‘2010-10-07 16:00‘, 61]
 38     }, {
 39         "value": [‘2010-10-09 19:00‘, 71]
 40     }
 41 ];
 42
 43 var bValueList = [{
 44         "value": [‘2010-10-01 06:00‘, 91]
 45     },
 46     {
 47         "value": [‘2010-10-03 09:00‘, 81]
 48     },
 49     {
 50         "value": [‘2010-10-04 09:00‘, 80]
 51     }, {
 52         "value": [‘2010-10-05 11:00‘, 1]
 53     },
 54     {
 55         "value": [‘2010-10-06 12:00‘, 51]
 56     },
 57     {
 58         "value": [‘2010-10-07 13:00‘, 11]
 59     }, {
 60         "value": [‘2010-10-09 16:00‘, 71]
 61     }
 62 ];
 63 var listYaxis = [];
 64 listYaxis.push({
 65     boundaryGap: [0, ‘50%‘],
 66     axisLine: {
 67         lineStyle: {
 68             color: "#000000"
 69         }
 70     },
 71     type: ‘value‘,
 72     name: "默认",
 73     axisLabel: {
 74         formatter: ‘{value}‘,
 75         textStyle: {
 76             color: ‘#000000‘
 77         }
 78     },
 79     position: ‘left‘,
 80     offset: 0,
 81     splitNumber: 0,
 82     splitLine: {
 83         show: true,
 84     },
 85     tooltip: {
 86         show: true,
 87         trigger: ‘axis‘
 88     },
 89     triggerEvent: true
 90 });
 91 listYaxis.push({
 92     boundaryGap: [0, ‘50%‘],
 93     type: ‘value‘,
 94     name: "默认22"
 95 });
 96
 97 var objP = [{}],
 98     m = 0;
 99 objP[m].yAxisIndex = 0;
100 var sname = "",
101     name = "";
102
103
104 var yMax = 200;
105 var xMax = 2;
106 var yMin = 21;
107 var xMin = 3;
108
109 // xAxis: {  type: ‘category‘ , splitLine: { show: false } },
110
111 option = {
112     title: {
113         text: name,
114         x: ‘center‘,
115         y: ‘top‘
116     },
117     tooltip: {
118         trigger: ‘axis‘
119     },
120     legend: {
121         data: [],
122         x: ‘left‘,
123         y: ‘top‘,
124         right: 50,
125         type: ‘scroll‘
126     },
127     dataZoom: {
128         show: true,
129         start: 0
130     },
131     calculable: true,
132     grid: {
133         left: ‘0%‘,
134         right: ‘0%‘,
135         bottom: ‘0%‘,
136         containLabel: true
137     },
138     toolbox: {
139         y: ‘top‘,
140         right: 15,
141         top: -3,
142         feature: {
143             saveAsImage: {}
144         }
145     },
146     xAxis: {
147         type: ‘time‘,
148         splitLine: {
149             show: false
150         }
151     },
152     yAxis: {
153         type: ‘value‘
154     },
155     series: []
156 };
157
158
159 //加载Y轴,并设定位置
160 option.yAxis = []
161 for (var y = 0; y < listYaxis.length; y++) {
162     option.yAxis.push(listYaxis[y])
163 }
164 option.grid.left = 10
165 if (listYaxis.length > 1) {
166     option.grid.right = ((option.yAxis.length - 2) * 30)
167 }
168
169
170
171 option.legend.data.push(sname + "-采集值")
172 option.series.push({
173     name: sname + "-采集值",
174     type: ‘line‘,
175     stack: ‘‘,
176     data: bValueList,
177     yAxisIndex: objP[m].yAxisIndex,
178     symbolSize: 0
179 })
180
181
182 option.legend.data.push(sname + "-水位")
183 option.series.push({
184     name: sname + "-水位",
185     type: ‘line‘,
186     stack: ‘‘,
187     data: aValueList,
188     yAxisIndex: objP[m].yAxisIndex,
189     symbolSize: 0,
190     areaStyle: {
191         normal: {
192             color: {
193                 type: ‘linear‘,
194                 x: 0,
195                 y: 0,
196                 x2: 0,
197                 y2: 1,
198                 colorStops: [{
199                     offset: 0,
200                     color: ‘rgba(88,160,253,1)‘
201                 }, {
202                     offset: 0.5,
203                     color: ‘rgba(88,160,253,0.7)‘
204                 }, {
205                     offset: 1,
206                     color: ‘rgba(88,160,253,0)‘
207                 }]
208             }
209         }
210     },
211     lineStyle: {
212         normal: {
213             color: ‘rgba(88,160,253,1)‘
214         }
215     },
216     itemStyle: {
217         normal: {
218             color: ‘rgba(88,160,253,1)‘
219         }
220     }
221 })
222
223
224 option.legend.data.push(sname + "-降雨量");
225 option.series.push({
226     name: sname + "-降雨量",
227     type: ‘bar‘,
228     itemStyle: {
229         normal: {
230             color: ‘#3FA7DC‘,
231             barBorderRadius: [6, 6, 0, 0]
232         }
233     },
234     stack: ‘‘,
235     barWidth: 30,
236 //    markPoint: {
237 //        data: [{     name: ‘最高‘,     value: yMax,     xAxis: xMax,     yAxis: yMax
238 //            },
239 //            {     name: ‘最低‘,     value: yMin,     xAxis: xMin,     yAxis: yMin
240 //            }
241 //        ]
242 //    } ,
243           markPoint: {
244                 data: [
245                     {type: ‘max‘, name: ‘最大值‘},
246                     {type: ‘min‘, name: ‘最小值‘}
247                 ]
248             },
249     data: ValueList,
250     yAxisIndex: objP[m].yAxisIndex,
251     symbolSize: 0
252 });
View Code