
在家呆着也是呆着,不如做点什么消磨时间呗~
干脆用django+pyecharts实现疫情数据可视化web页面:
要爬的数据来自丁香园、搜狗及百度的疫情实时动态展示页
先看看劳动成果:
导航栏:

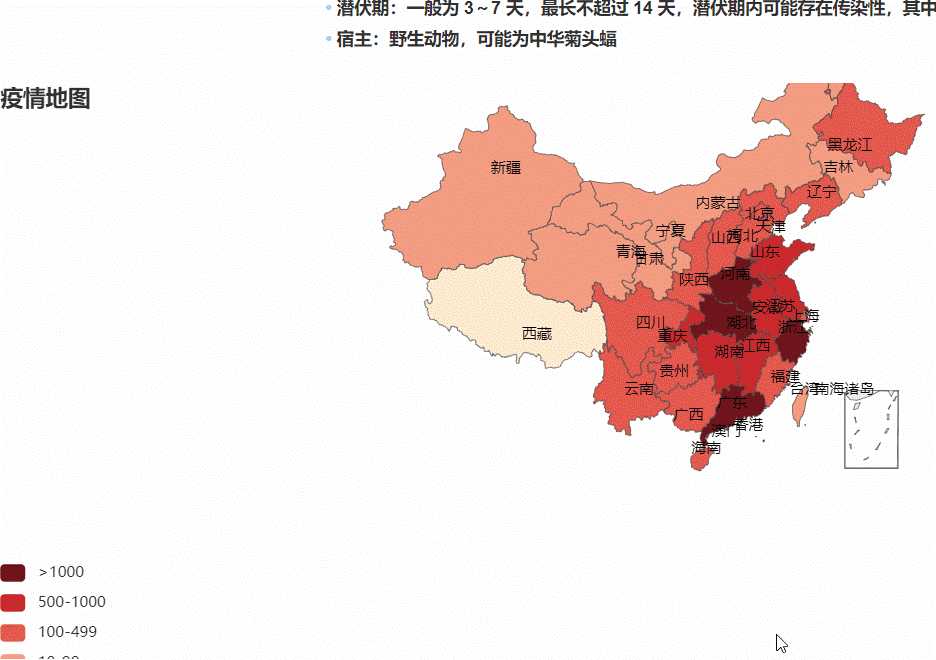
疫情地理热力图:
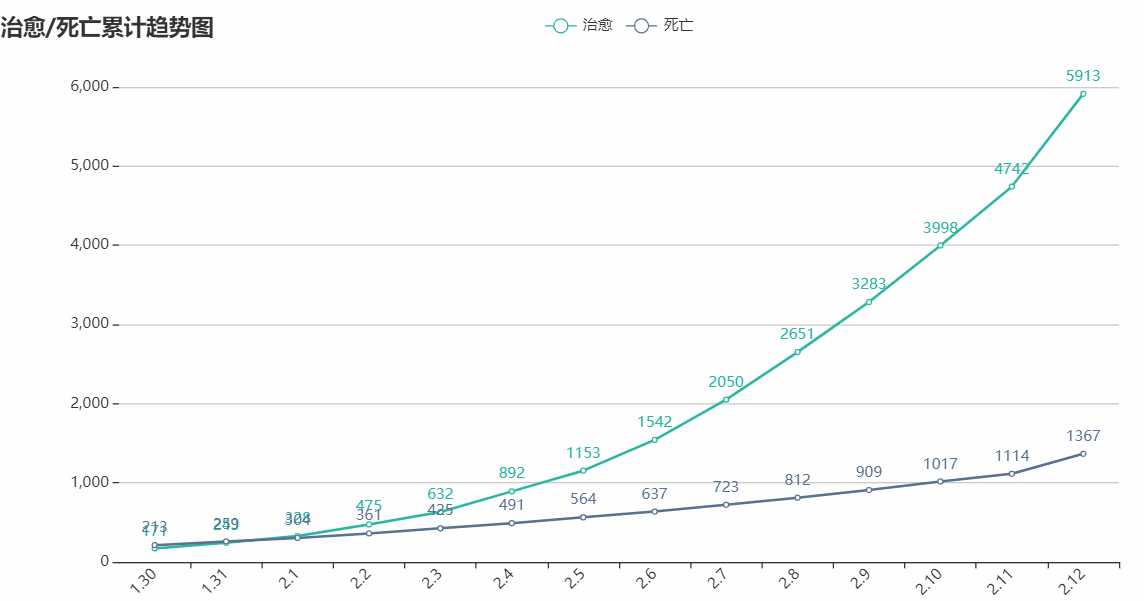
治愈/死亡折线图
舆论词云:

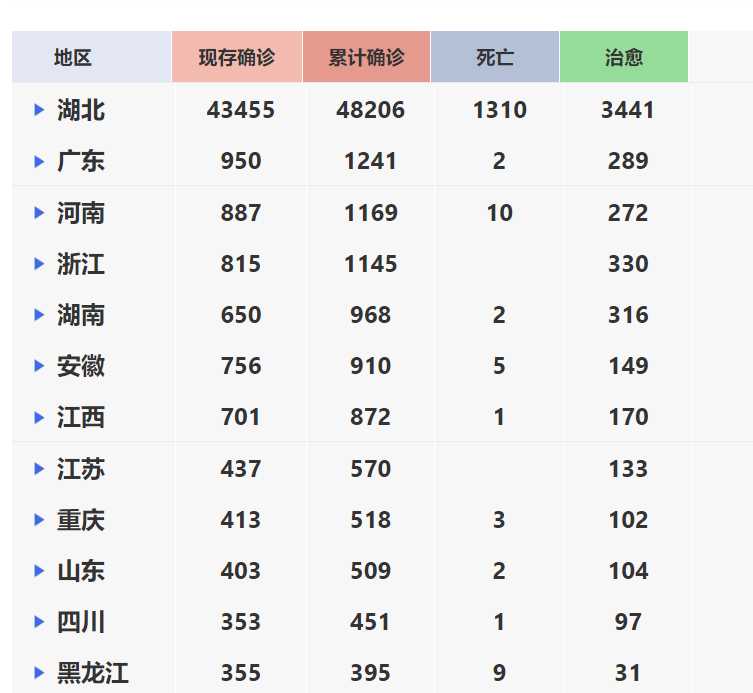
丁香园要爬的数据,这些数据用在那个地理热力图上:
丁香园疫情实时动态(超链接)
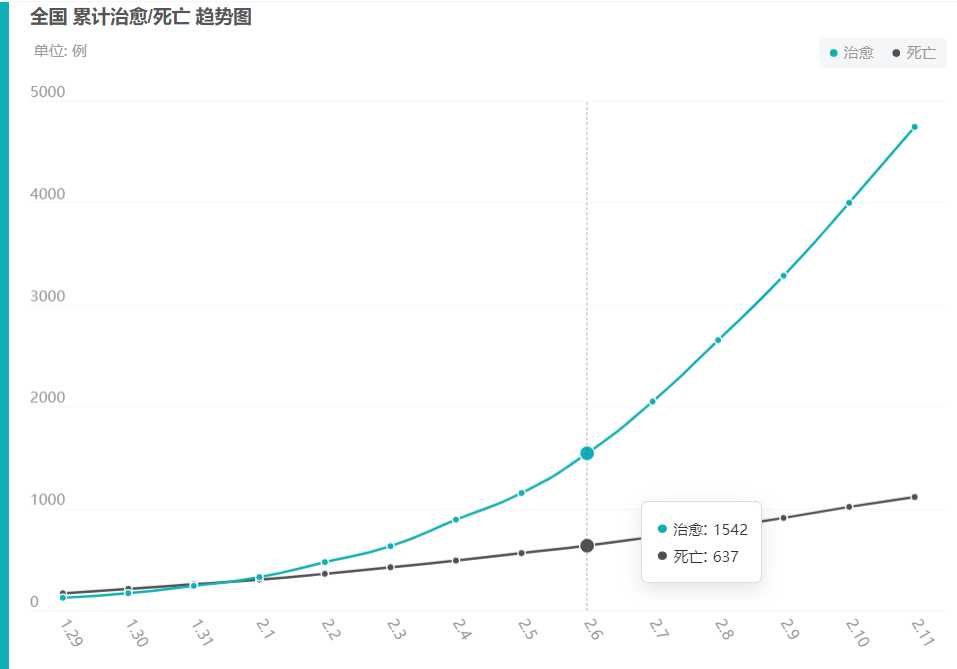
百度要爬的数据,历史数据,用在治愈/死亡折线图上:
搜狗要爬的数据,用在导航栏那几个统计的总数:

还有这里,用于获取媒体的文章。制作词云~

emmm…
正文:
爬虫:
爬这些数据其实很简单,需要的数据都在html源码里,直接用requests请求链接后用re匹配就行,而且这些网站甚至都不用伪造请求头来访问。。。
爬虫代码:
import requests
import json
import re
import time
from pymongo import MongoClient


def insert_item(item, type_):
    ‘‘‘
    插入数据到mongodb,item为要插入的数据,type_用来选择collection
    ‘‘‘
    databaseIp=‘127.0.0.1‘
    databasePort=27017
    client = MongoClient(databaseIp, databasePort)
    mongodbName = ‘dingxiang‘
    db = client[mongodbName]
    if type_ == ‘dxy_map‘:
        # 更新插入
        db.dxy_map.update({‘id‘: item[‘provinceName‘]}, {‘$set‘: item}, upsert=True)
    elif type_ == ‘sogou‘:
        # 直接插入
        db.sogou.insert_one(item)
    else:
        # 更新插入
        db.baidu_line.update({},{‘$set‘: item}, upsert=True)
    print(item,‘插入成功‘)
    client.close()

def dxy_spider():
    ‘‘‘
    丁香园爬取,获取各省份的确诊数,用来做地理热力图
    ‘‘‘
    url = ‘https://ncov.dxy.cn/ncovh5/view/pneumonia‘
    r = requests.get(url)
    r.encoding = ‘utf-8‘
    res = re.findall(‘tryTypeService1 =(.*?)}catch‘, r.text, re.S)
    if res:
        # 获取数据的修改时间
        time_result = json.loads(res[0])
    res = re.findall(‘getAreaStat =(.*?)}catch‘, r.text, re.S)
    if res:
        # 获取省份确诊人数数据
        all_result = json.loads(res[0])
    for times in time_result:
        for item in all_result:
            if times[‘provinceName‘] == item[‘provinceName‘]:
                # 因为省份确诊人数的部分没有时间,这里将时间整合进去
                item[‘createTime‘] = times[‘createTime‘]
                item[‘modifyTime‘] = times[‘modifyTime‘]
                insert_item(item,‘dxy_map‘)

def sogou_spider():
    ‘‘‘
    搜狗爬虫,获取所有确诊数、治愈数等,用在导航栏直接显示
    ‘‘‘
    url = ‘http://sa.sogou.com/new-weball/page/sgs/epidemic‘
    r = requests.get(url=url)
    sum_res = re.findall(‘"domesticStats":({"tim.*?}})‘,r.text)
    if sum_res:
        sum_result = json.loads(sum_res[0])
        # 增加一个爬取时间字段
        sum_result[‘crawl_time‘] = int(time.time())
        insert_item(sum_result,‘sogou‘)

def baidu_spider():
    ‘‘‘
    百度爬虫,爬取历史数据,用来画折线图
    ‘‘‘
    url = ‘https://voice.baidu.com/act/newpneumonia/newpneumonia‘
    r = requests.get(url=url)
    res = re.findall(‘"degree":"3408"}],"trend":(.*?]}]})‘,r.text,re.S)
    data = json.loads(res[0])
    insert_item(data,‘baidu_line‘)

if __name__ == ‘__main__‘:
    dxy_spider()
    sogou_spider()
    baidu_spider()
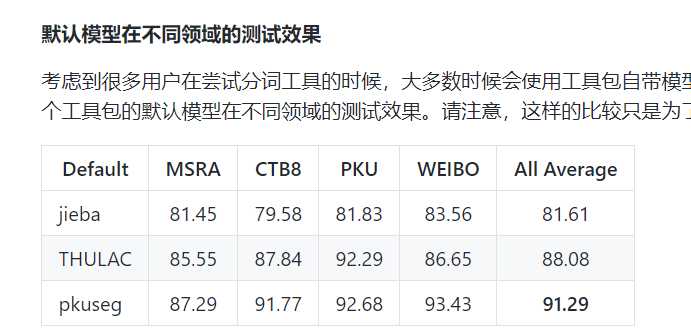
词云的数据准备则麻烦一点,中文分词可是个麻烦事…
所以选了个精度还不错的pkuseg(pkuseg官方测试~)
代码:
import requests
import json
import pkuseg
from lxml import etree


‘‘‘爬虫部分,获取相关文章内容,用来生成词云‘‘‘
headers= {
    ‘User-Agent‘: ‘Mozilla/5.0 (Windows NT 10.0; WOW64) AppleWebKit/537.36 (KHTML, like Gecko) Chrome/79.0.3945.88 Safari/537.36‘
}
url = ‘https://sa.sogou.com/new-weball/api/sgs/epi-protection/list?type=‘
type_ = [‘jujia‘,‘chunyun‘,‘waichu‘,‘kexue‘]

def down_text(type_):
    r = requests.get(url=url+type_,headers=headers)
    res = json.loads(r.text)
    for i in res[‘list‘]:
        print(i[‘linkUrl‘])
        r = requests.get(url = i[‘linkUrl‘],headers=headers)
        html = etree.HTML(r.text)
        # 获取文章所有文本
        div = html.xpath(‘//div[@class="word-box ui-article"]//text()‘)
        string = ‘‘
        for i in div:
            string += i+‘\n‘
        # 保存文本到note.txt
        with open(‘note.txt‘,‘a‘,encoding=‘utf-8‘) as f:
            f.write(string)
def down_all():
    for i in type_:
        down_text(i)

‘‘‘分词统计部分,用pkuseg对下载的文本进行分词并统计词频‘‘‘
def word_count():
    with open(‘note.txt‘, ‘r‘, encoding=‘utf-8‘) as f:
        text = f.read()
    # 自定义词典,意味着分词时会专门保留出这些词
    user_dict = [‘冠状病毒‘]
    # 以默认配置加载模型
    seg = pkuseg.pkuseg(user_dict=user_dict)
    # 进行分词
    text = seg.cut(text)
    # 读取停用词表
    with open(‘stop_word.txt‘, ‘r‘, encoding=‘utf-8‘) as f:
        s_word = f.readlines()
    # 停用词表一个停用词占一行,因为这样读readlines()会带上换行符在每个词后面
    # 使用map对列表所有词去掉空字符
    s_word = list(map(lambda x: x.strip(), s_word))
    count = {}
    # 统计词频
    for word in text:
        # 当这个词不在停用词表中并且长度不为1才统计
        if word in s_word or len(word) == 1:
            continue
        else:
            if word in count:
                # 已经记录过,加1
                count[word] += 1
            else:
                # 否则将该词添加到字典中
                count[word] = 1
    all_pair = []
    # 将统计的字典转换为pyecharts词云要求的输入
    # 比如这样:words = [("Sam S Club", 10000),("Macys", 6181)],前面是词,后面是词频
    for pair in count:
        all_pair.append((pair, count[pair]))
    # 对结果排序
    li = sorted(all_pair, key=lambda x: x[1], reverse=True)
    # 将列表转str直接写入文件中,到时直接给pyecharts用
    # 不要每次都分词,分词过程有点慢
    with open(‘word_count.txt‘,‘w‘,encoding=‘utf-8‘) as f:
        f.write(str(li))
if __name__ == ‘__main__‘:
    down_all()
    word_count()
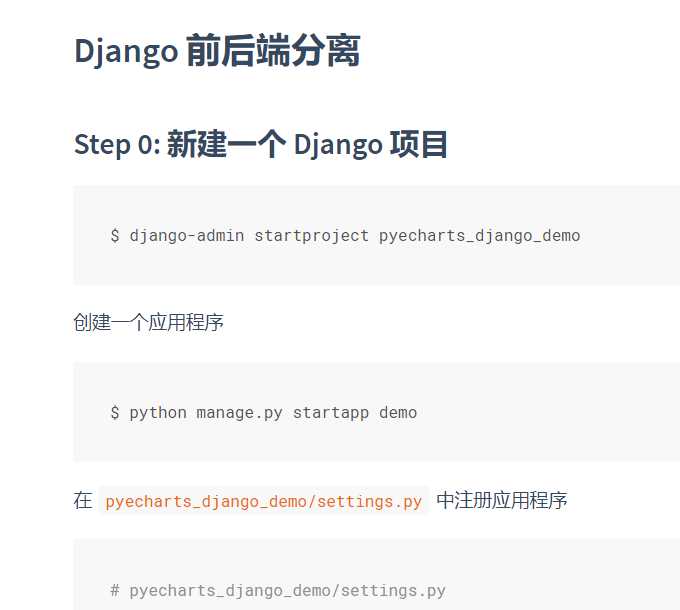
Django+pyecharts建立web应用
这里先按pyecharts的文档来创建一个前后端分离的django项目
https://pyecharts.org/#/zh-cn/web_django
这里:
然后渐进修改,这里给出views.py及html的代码:
views.py
import json
import time
from django.http import HttpResponse
from django.shortcuts import render
from pymongo import MongoClient
from pyecharts.charts import Line, Map, WordCloud
from pyecharts import options as opts


def get_data(type_):
    ‘‘‘
    返回用于制作地理热力图的数据,省份名和省份确诊数
    ‘‘‘
    databaseIp=‘127.0.0.1‘
    databasePort=27017
    # 连接mongodb
    client = MongoClient(databaseIp, databasePort)
    mongodbName = ‘dingxiang‘
    db = client[mongodbName]
    if type_ == ‘map‘:
        collection = db.dxy_map
    elif type_ == ‘sogou‘:
        collection = db.sogou
    elif type_ == ‘line‘:
        collection = db.baidu_line
    alls = collection.find()
    return alls
cure_data = get_data(‘line‘)[0]

def timestamp_2_date(timestamp):
    ‘‘‘
    用来将时间戳转为日期时间形式
    ‘‘‘
    time_array = time.localtime(timestamp)
    my_time = time.strftime("%Y-%m-%d %H:%M", time_array)
    return my_time

def json_response(data, code=200):
    ‘‘‘
    用于返回json数据,主要是将图表信息作为json返回
    ‘‘‘
    data = {
        "code": code,
        "msg": "success",
        "data": data,
    }
    json_str = json.dumps(data)
    response = HttpResponse(
        json_str,
        content_type="application/json",
    )
    response["Access-Control-Allow-Origin"] = "*"
    return response

JsonResponse = json_response

def index(request):
    ‘‘‘
    返回首页数据
    ‘‘‘
    alls = get_data(‘sogou‘).sort("crawl_time", -1).limit(1)
    if alls:
        alls = alls[0]
    alls[‘timestamp‘] /= 1000
    alls[‘timestamp‘] = timestamp_2_date(alls[‘timestamp‘])
    return render(request, "index.html", alls)

def heat_map(request):
    ‘‘‘
    地理热力图,以json返回
    ‘‘‘
    map_data = []
    alls = get_data(‘map‘)
    for item in alls:
        # 将各省份名和确诊数组合成新的列表,以符合pyecharts map的输入
        map_data.append([item[‘provinceShortName‘], item[‘confirmedCount‘]])
    max_ = max([i[1] for i in map_data])
    map1 = (
        Map()
        # is_map_symbol_show去掉默认显示的小红点
        .add("疫情", map_data, "china", is_map_symbol_show=False)
        .set_global_opts(
            #不显示legend
            legend_opts=opts.LegendOpts(is_show=False),
            title_opts=opts.TitleOpts(title="疫情地图"),
            visualmap_opts=opts.VisualMapOpts(
                # 最大值
                max_=max_,
                # 颜色分段显示
                is_piecewise=True,
                # 自定义数据段,不同段显示不同的自定义的颜色
                pieces=[
                 {"min": 1001,  "label": ">1000", ‘color‘:‘#70161d‘},
                 {"max": 1000, "min": 500,  "label": "500-1000", ‘color‘:‘#cb2a2f‘},
                 {"max": 499, "min": 100, "label": "100-499", ‘color‘:‘#e55a4e‘},
                 {"max": 99, "min": 10, "label": "10-99", ‘color‘:‘#f59e83‘},
                 {"max": 9, "min": 1, "label": "1-9",‘color‘:‘#fdebcf‘},
             ]
                ),
        )
        # 获取全局 options,JSON 格式(JsCode 生成的函数带引号,在前后端分离传输数据时使用)
        .dump_options_with_quotes()
    )
    return JsonResponse(json.loads(map1))

def cure_line(request):
    ‘‘‘
    治愈/死亡折线图,以json返回
    ‘‘‘

    line2 = (
        Line()
        .add_xaxis(cure_data[‘updateDate‘])
        .add_yaxis(‘治愈‘, cure_data[‘list‘][2][‘data‘],color=‘#5d7092‘,linestyle_opts = opts.LineStyleOpts(width=2))
        .add_yaxis(‘死亡‘, cure_data[‘list‘][3][‘data‘],color=‘#29b7a3‘,linestyle_opts = opts.LineStyleOpts(width=2))
        .set_global_opts(
        title_opts=opts.TitleOpts(title=‘治愈/死亡累计趋势图‘,pos_top=‘top‘),
        # x轴字体偏移45度
        xaxis_opts=opts.AxisOpts(axislabel_opts=opts.LabelOpts(rotate=45)),
        yaxis_opts=opts.AxisOpts(
            type_="value",
            # 显示分割线
            splitline_opts=opts.SplitLineOpts(is_show=True),
            # 不显示y轴的黑线
            axisline_opts=opts.AxisLineOpts(is_show=False),
        ),
        tooltip_opts=opts.TooltipOpts(
            # 启用提示线,当鼠标焦点在图上时会显现
            is_show=True, trigger="axis", axis_pointer_type="cross",
        ),
        )
        .dump_options_with_quotes()
    )
    return JsonResponse(json.loads(line2))

def confirm_line(request):
    ‘‘‘
    确诊/疑似折线图,以json返回
    ‘‘‘
    line2 = (
        Line()
        .add_xaxis(cure_data[‘updateDate‘])
        .add_yaxis(‘确诊‘, cure_data[‘list‘][0][‘data‘],color=‘#f9b97c‘,linestyle_opts = opts.LineStyleOpts(width=2))
        .add_yaxis(‘疑似‘, cure_data[‘list‘][1][‘data‘],color=‘#ae212c‘,linestyle_opts = opts.LineStyleOpts(width=2))

        .set_global_opts(
        title_opts=opts.TitleOpts(title=‘确诊/疑似累计趋势图‘,pos_top=‘top‘),
        xaxis_opts=opts.AxisOpts(axislabel_opts=opts.LabelOpts(rotate=45)),
        yaxis_opts=opts.AxisOpts(
            type_="value",
            splitline_opts=opts.SplitLineOpts(is_show=True),
            axisline_opts=opts.AxisLineOpts(is_show=False),
        ),
        tooltip_opts=opts.TooltipOpts(
            is_show=True, trigger="axis", axis_pointer_type="cross",
        ),
        )
        .dump_options_with_quotes()
    )
    return JsonResponse(json.loads(line2))

def word_cloud(request):
    with open(‘demo/data/word_count.txt‘,‘r‘,encoding=‘utf-8‘) as f:
        li = eval(f.read())
    c = (
        WordCloud()
            .add("", li[:151], word_size_range=[20, 100], shape="circle")
            .set_global_opts(title_opts=opts.TitleOpts(title="舆论词云"))
            .dump_options_with_quotes()
    )
    return JsonResponse(json.loads(c))
index.html
<!DOCTYPE html>
<html lang="zh-CN">
  <head>
    <meta charset="utf-8">
    <meta http-equiv="X-UA-Compatible" content="IE=edge">
    <meta name="viewport" content="width=device-width, initial-scale=1">
    <!-- 上述3个meta标签*必须*放在最前面,任何其他内容都*必须*跟随其后! -->
    <title>实时动态</title>
    <script type="text/javascript" src="/static/echarts.min.js"></script>

    <script type="text/javascript" src="/static/echarts-wordcloud.min.js"></script>
    <script type="text/javascript" src="/static/maps/china.js"></script>
    <script src="https://cdn.bootcss.com/jquery/3.0.0/jquery.min.js"></script>
    <!-- Bootstrap -->
    <script src="https://cdn.jsdelivr.net/npm/bootstrap@3.3.7/dist/js/bootstrap.min.js"></script>
    <link href="https://cdn.jsdelivr.net/npm/bootstrap@3.3.7/dist/css/bootstrap.min.css" rel="stylesheet">
    <link href="/static/css/grid.css" rel="stylesheet">
  </head>
  <body>

  <img src="/static/imgs/timg.jpg" alt="" style="width: 100%;height: 450px">
  <span style="color: #666;margin-left: 25rem;">截至 {{ timestamp }} 全国数据统计</span>
    <div class="container-fluid ">
      <div class="row">
        <div class="col-md-2 col-md-offset-2" style="border-left: none;">
            <b>较昨日<em style="color: rgb(247, 76, 49);">+{{ yesterdayIncreased.diagnosed }}</em></b>
            <strong style="color: rgb(247, 76, 49);">{{ diagnosed }}</strong>
            <span>累计确诊</span>
        </div>
        <div class="col-md-2">
            <b>较昨日<em style="color: rgb(247, 130, 7);">+{{ yesterdayIncreased.suspect }}</em></b>
            <strong style="color: rgb(247, 130, 7);">{{ suspect }}</strong>
            <span>现有疑似</span>
        </div>
        <div class="col-md-2" style="border-right: none;">
            <b>较昨日<em style="color: rgb(40, 183, 163);">+{{ yesterdayIncreased.cured }}</em></b>
            <strong style="color: rgb(40, 183, 163);">{{ cured }}</strong>
            <span>累计治愈</span>
        </div>
        <div class="col-md-2">
            <b>较昨日<em style="color: rgb(93, 112, 146);">+{{ yesterdayIncreased.death }}</em></b>
            <strong style="color: rgb(93, 112, 146);">{{ death }}</strong>
            <span>累计死亡</span>
        </div>

      </div>
    </div>

     <ul>
        <li>病毒:SARS-CoV-2,其导致疾病命名 COVID-19</li>
        <li>传染源:新冠肺炎的患者。无症状感染者也可能成为传染源</li>
        <li>传播途径:经呼吸道飞沫、接触传播是主要的传播途径。气溶胶传播和消化道等传播途径尚待明确</li>
        <li>易感人群:人群普遍易感。老年人及有基础疾病者感染后病情较重,儿童及婴幼儿也有发病</li>
        <li>潜伏期:一般为 3~7 天,最长不超过 14 天,潜伏期内可能存在传染性,其中无症状病例传染性非常罕见</li>
        <li>宿主:野生动物,可能为中华菊头蝠</li>
    </ul>
    <div id="map" style="width:1000px; height:500px;margin:0 auto;margin-bottom: 2rem;"></div>
    <div id="confirm_line" style="width:1000px; height:500px;margin:0 auto;"></div>
    <div id="cure_line" style="width:1000px; height:500px;margin:0 auto;margin-bottom: 2rem;"></div>
    <div id="word_cloud" style="width:1000px; height:500px;margin:0 auto;margin-bottom: 2rem;"></div>
  <script type="text/javascript" src="/static/chart.js"></script>
  </body>
</html>
然后还会用到js来生成图表。这里就不贴js代码了。
至于项目完整代码我会上传到github,有兴趣可以左上角直达了解下~
END