在网上看到了一个非常好的JS烟雾效果 https://paveldogreat.github.io/WebGL-Fluid-Simulation/
看源码时发现了dat.gui很好用。
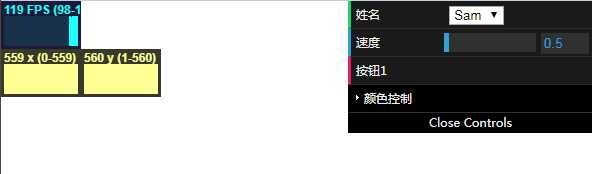
dat.gui
快速参数配置生成
源码地址:https://github.com/dataarts/dat.gui
stats.js
图形化统计性能及计数
源码地址:https://github.com/mrdoob/stats.js
效果如下:

代码如下:
<!DOCTYPE html>
<html lang="zh-CN">
<head>
<meta charset="utf-8">
<meta http-equiv="X-UA-Compatible" content="IE=edge">
<meta name="renderer" content="webkit">
<meta name="viewport" content="width=device-width, initial-scale=1">
<title>dat_gui 数据测试</title>
<style>
/* css style */
</style>

<script src="https://lib.baomitu.com/jquery/3.3.1/jquery.min.js"></script>
<script src="https://lib.baomitu.com/dat-gui/0.7.3/dat.gui.min.js"></script>
<script src="https://lib.baomitu.com/stats.js/16/Stats.min.js"></script>
<script>
// js script
var gui;
var data = {
    name: ‘Sam‘,
    speed: 0.5,
    color1: ‘#FF0000‘, // CSS string
    color2: [ 0, 128, 255 ], // RGB array
    color3: [ 0, 128, 255, 0.3 ], // RGB with alpha
    color4: { h: 350, s: 0.9, v: 0.3 }, // Hue, saturation, value
    fn: function(){
        alert(‘自定义函数‘);
    }
};

$(function(){
    gui = new dat.GUI({
        closed: true,
        useLocalStorage: true,
    });

    gui.add(data, ‘name‘, [‘Sam‘, ‘Hello‘, ‘h1‘]).name(‘姓名‘);
    var control = gui.add(data, ‘speed‘, 0, 10).name(‘速度‘);
    gui.add(data, ‘fn‘).name(‘按钮1‘);

    var f1 = gui.addFolder(‘颜色控制‘);
    f1.addColor(data, ‘color1‘);
    f1.addColor(data, ‘color2‘);
    f1.addColor(data, ‘color3‘);
    f1.addColor(data, ‘color4‘);

    control.onChange(function(value) {
        console.log("onChange:" + value)
    });

    control.onFinishChange(function(value) {
        console.log("onFinishChange" + value)
    });

    // 统计测试
    var stats = new Stats();
    var xPanel = stats.addPanel( new Stats.Panel( ‘x‘, ‘#ff8‘, ‘#221‘ ) );
    var yPanel = stats.addPanel( new Stats.Panel( ‘y‘, ‘#ff8‘, ‘#221‘ ) );
    document.body.appendChild( stats.dom );

    var x = 0;
    function animate() {
        stats.begin();

        xPanel.update( x++, 460 );
        yPanel.update( x%1000, 460 );
        stats.update();
        // monitored code goes here
        stats.end();
        requestAnimationFrame( animate );
    }

    requestAnimationFrame( animate );
});
</script>
</head>
<body>

</body>